Join Our Telegram channel to stay up to date on breaking news coverage
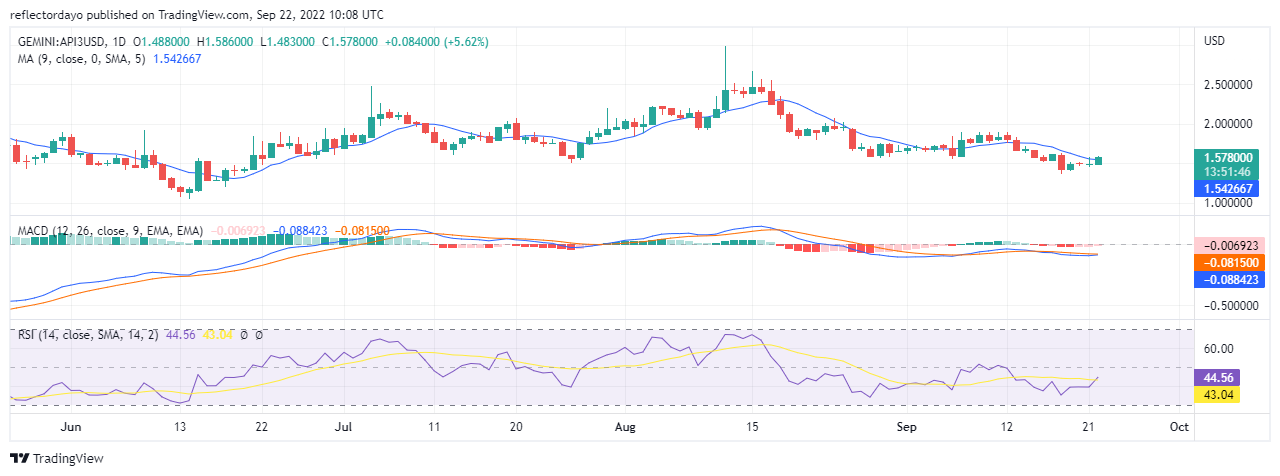
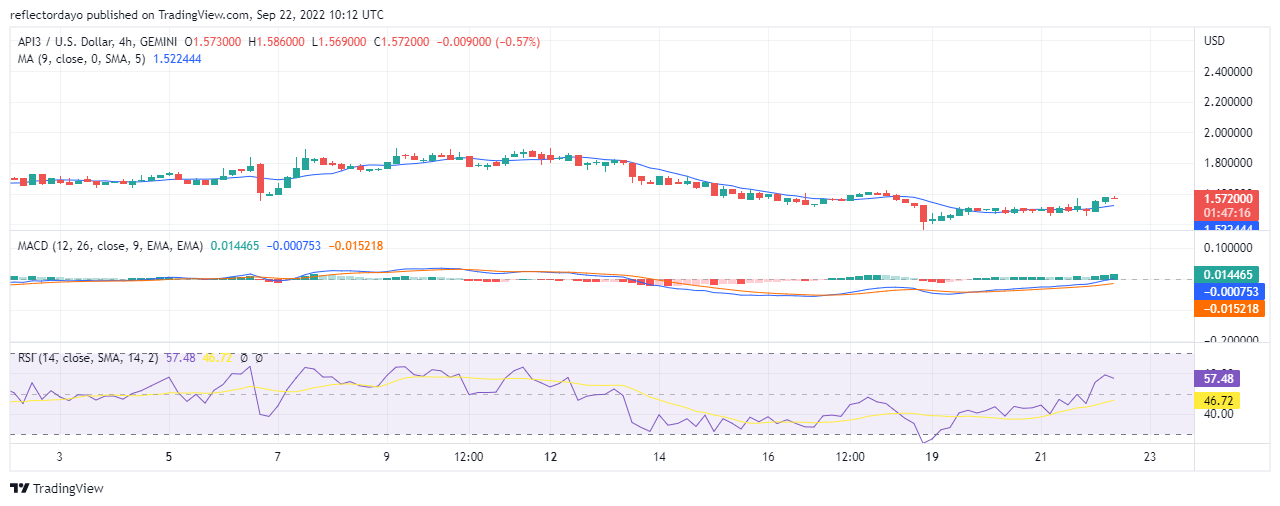
On the 19th of September, the price reaches the support level of $1.5000. Then buyers and sellers had a fruitless tug-of-war for two days. The price of API3/USD remained at that price level of $1.5000. Finally, in today’s market, the price actions have broken away from the gridlock market; pushing the price to a higher price level
API3 Market Price Statistic:
- API3/USD price now: S1.578000
- API3/USD market cap: $88,929,362
- API3/USD circulating supply: 56,547,601
- API3/USD total supply: 114,855,860
- API3 /USD coin market ranking: #253
Key Levels
- Resistance: $ 1.60000, $1.630000, $1.6500000
- Support: $1.4700000, $1.450000, $1.400000
Your capital is at risk
API3 Market Price Analysis: The Indicators’ Point of View
From the Moving Average Convergence and Divergence indicator, the fast and slow lines are moving along closely and horizontally at the lower territory. The MACD line is slightly below the signal line which means a bearish market. But the MACD histograms give the impression that the bearish moves may be waning because the tiny histograms are now appearing in pink.
API3/USD 4-Hour Chart Outlook
After the day opened with very strong bullish momentum, it continued to go in favour of bulls as selling pressure appear to be very weak. The candles in the sessions for today show smaller shadows below and above the candles. The Relative Strength Index measures market strength at 59%. The probability that the bullish move will continue is very high.
Related
Join Our Telegram channel to stay up to date on breaking news coverage
