Join Our Telegram channel to stay up to date on breaking news coverage
Binance Coin Price Prediction – September 21
The BNB/USD market still looks to hold a bullish momentum as the crypto trade finds support around a longing path to the north side. Price has traded between $264.30 and $270.90 value-lines in the last twenty-four hours. As of the time of writing, the market’s valuation is at $269.90 at an average percentage rate of 1.35 positive.
Binance Coin Price Statistics:
BNB price now – $267.75
BNB market cap – $43.2 billion
BNB circulating supply – 161.3 million
BNB total supply – 161.3 million
Coinmarketcap ranking – #5
Binance Coin Market
Key Levels:
Resistance levels: $290, $310, $330
Support levels: $250, $230, $210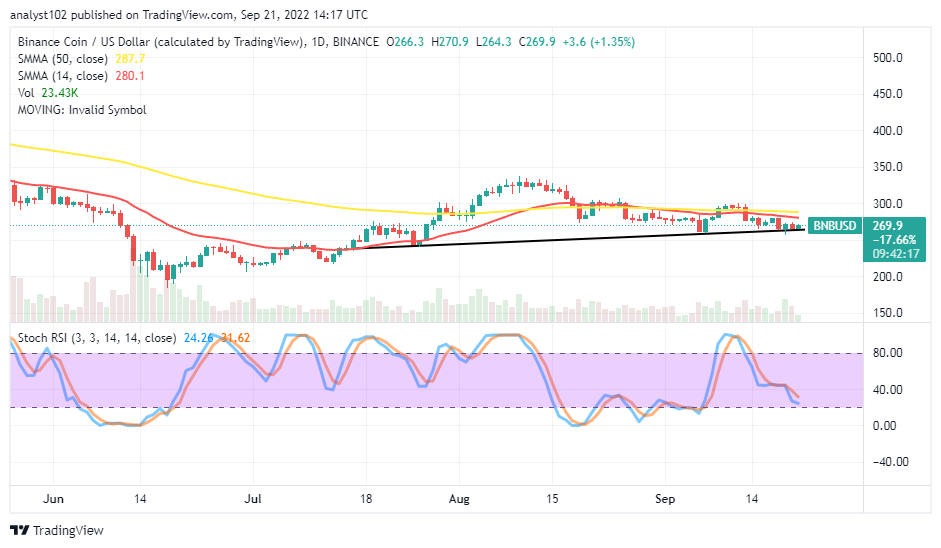 BNB /USD – Daily Chart
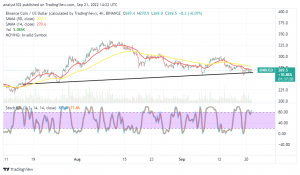
The daily chart reveals the BNB/USD market finds support around the trend line of the bullish trend line drawn underneath the trend lines of the SMAs. The two trend lines of the trading indicators are not too far from each other, as the 14-day SMA is at $280.10, underneath the $287.70 value point of the 50-day SMA. The Stochastic Oscillators have moved southbound toward the range of 20 to place at 31.62 and 24.26 range values.
Your capital is at risk.
Are there probabilities that the BNB/USD market bears can push to the $250 level?
There are possibilities that the BNB/USD market bears can push to the $250 level for a final finding of support even though the crypto finds support around the bullish trend line drawn below the SMA trading indicators. The emergence of a bullish candlestick around the bullish trend line drawn or around the value point in question will probably produce a rebound or a rallying motion that can successfully pass through the resistances of the SMA trend lines.
On the downside of the technical analysis, there appears not to have a smooth running of a downward-trending motion further below the bullish trend line drawn on the daily trading chart. In light of that assumption, short-position placers to be cautious of exerting new selling position orders to avoid unnecessary bear traps. Some lower lows may build in the following days’ operations below the 14-day SMA trend line. But, sellers shouldn’t be eager to ride for long on any moves attempted to be in a downward direction afterward.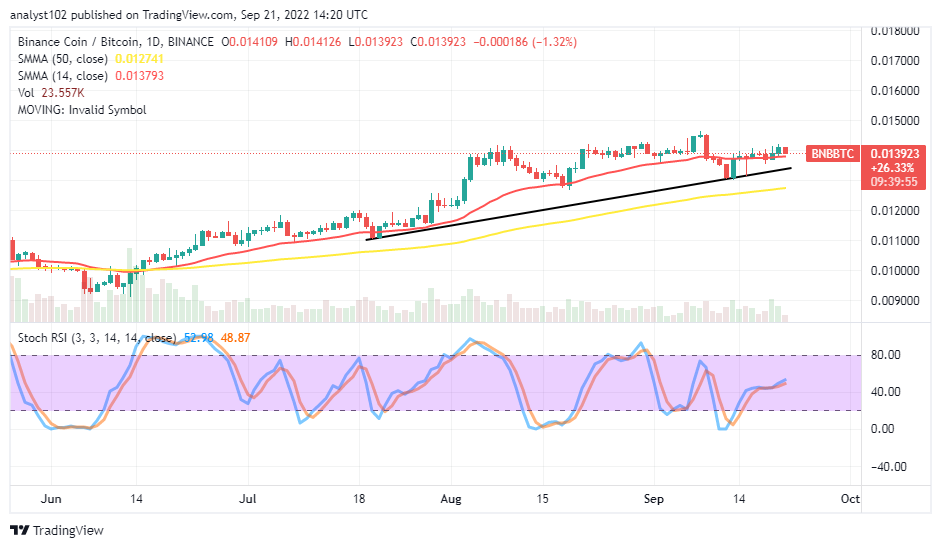
BNB/BTC Price Analysis
Binance Coin is trending higher to some reasonable extent against the purchasing capability of Bitcoin. The cryptocurrency pair price finds support around the buying signal side of the smaller SMA trend line. The 50-day SMA indicator is underneath the 14-day SMA indicator. The Stochastic Oscillators are attempting to open their lines northbound from 48.87 and 52.98 range values. A smaller bearish candlestick shows that the base crypto is debasing lightly around the trend line of smaller SMA against its counter crypto. That could mean the pairing crypto trade still needs some respites to properly build on a baseline before experiencing swing highs.
Read more:
Join Our Telegram channel to stay up to date on breaking news coverage