Join Our Telegram channel to stay up to date on breaking news coverage
The ApeCoin price prediction shows that APE may head toward the upper boundary of the channel, if the price rises further, it could create additional gains.
ApeCoin Prediction Statistics Data:
- ApeCoin price now – $2.33
- ApeCoin market cap – $864 million
- ApeCoin circulating supply – 368.5 million
- ApeCoin total supply – 1 billion
- ApeCoin Coinmarketcap ranking – #47
APE/USD Market
Key Levels:
Resistance levels: $3.2, $3.4, $3.6
Support levels: $1.5, $1.3, $1.1
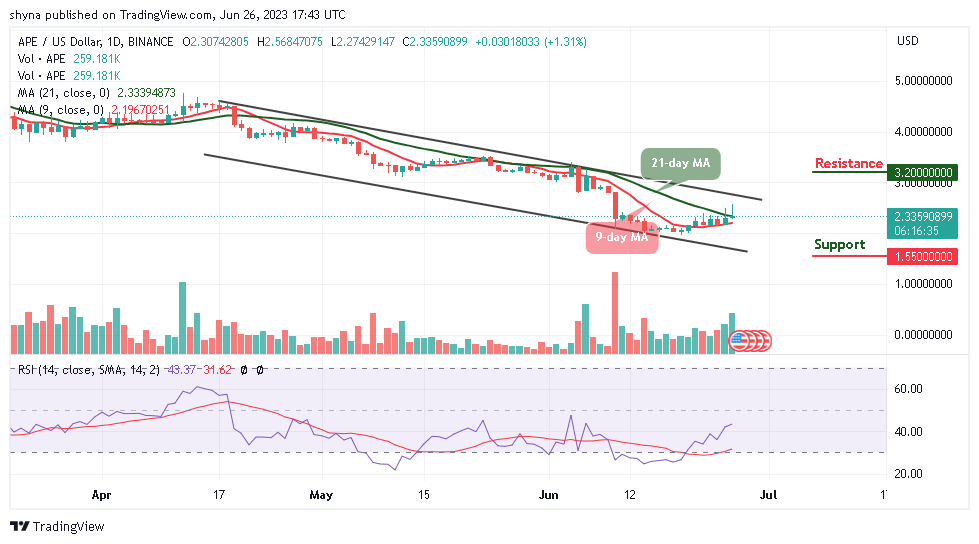
APE/USD is currently trading around the $2.33 level above the 9-day and 21-day moving averages. In the range of the descending channel, the closest resistance could be located at $3.0, with a close resistance at $2.70. Meanwhile, if the market increases, additional resistance can be found above the upper boundary of the channel.
ApeCoin Price Prediction: ApeCoin (APE) May Go Bullish
As revealed by the daily chart, it is obvious that the ApeCoin price may likely create more bullish trends once the bearish movement fades away, and this is noticeable for the technical indicator Relative Strength Index (14) as the signal line moves above the 40-level.
At the time of writing, the ApeCoin market keeps rebounding from the daily low of $2.27; meanwhile, any bearish movement below the daily low could lead the coin to a serious downtrend toward the lower boundary of the channel. However, the support levels for the coin may be located at $1.5, $1.3, and $1.1, while the resistance levels lie at $3.2, $3.4, and $3.6 respectively.
Against Bitcoin, the support level is built around 750 SAT. The nearest resistance level is set at 850 SAT because the ApeCoin price is still hovering within the 9-day and 21-day moving averages. Technically, the price may continue to follow the bullish movement if the technical indicator Relative Strength Index (14) recovers above the 30-level.
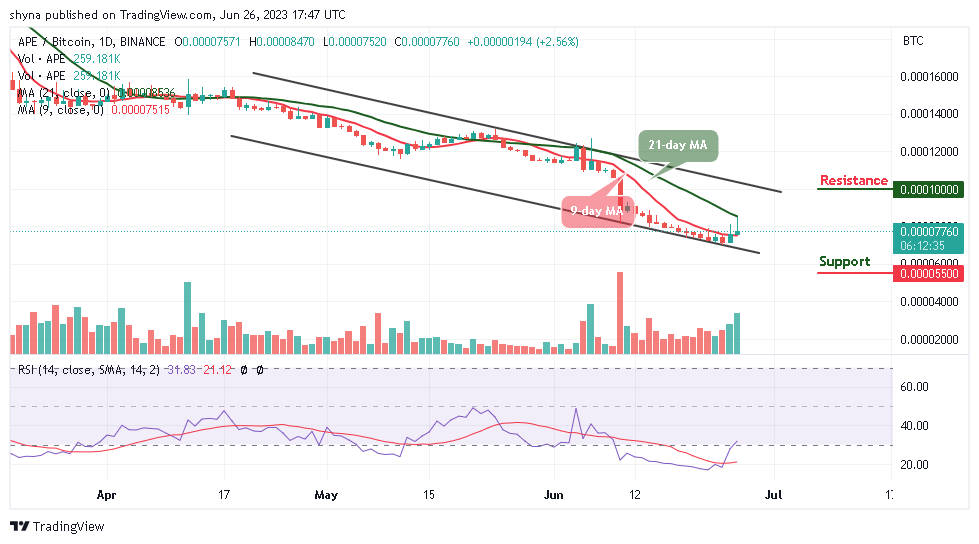
However, if the ApeCoin price crosses below the 9-day moving average, APE/BTC may likely hit the support level at 550 SAT and below. Moreover, any bullish cross above the upper boundary of the channel may allow the market to form a new upward trend and could reach the potential resistance at 1000 SAT and above.
ApeCoin Alternatives
According to the daily chart, the bull market is already facing some struggle with the selling pressure as it approaches the resistance and the market trend is already bullish. The price according to the Relative Strength Index (14) is recovering from the oversold region.
Meanwhile, the Wall Street Memes project takes a giant step beyond the already-existing tokens in a number of ways. Its unique selling points mean it is likely to be a top crypto project in short order as about $10 million has been raised in the ongoing presale.
Read more:
- Bitcoin Price Prediction: BTC/USD Could Explodes Above $13,600
- SHIB Price Prediction for Today, August 14: Is SHIB Prepared for a Strong Upside Price Rally?
- Litecoin Price Prediction: LTC/USD May Break Below $190 before Pushing Higher Again
New OKX Listing - Wall Street Memes

- Established Community of Stocks & Crypto Traders
- Featured on Cointelegraph, CoinMarketCap, Yahoo Finance
- Rated Best Crypto to Buy Now In Meme Coin Sector
- Team Behind OpenSea NFT Collection - Wall St Bulls
- Tweets Replied to by Elon Musk
Join Our Telegram channel to stay up to date on breaking news coverage