
Join Our Telegram channel to stay up to date on breaking news coverage
The ApeCoin price prediction shows that APE is breaking toward the 9-day and 21-day moving averages to begin the bullish movement.
ApeCoin Prediction Statistics Data:
- ApeCoin price now – $4.0
- ApeCoin market cap – $1.5 billion
- ApeCoin circulating supply – 368.5 million
- ApeCoin total supply – 1 billion
- ApeCoin Coinmarketcap ranking – #37
APE/USD Market
Key Levels:
Resistance levels: $5.5, $6.0, $6.5
Support levels: $2.5, $2.0, $1.5
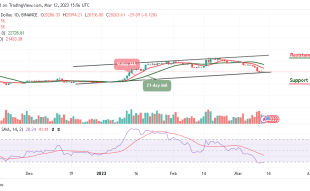
APE/USD is seen refreshing to a new high after touching the daily low of $3.78 to touch $4.0 as the coin currently trades at $4.06 with a bullish movement in the intraday. Today, the ApeCoin price continues to head toward the 9-day and 21-day moving averages but higher support is expected at the $3.5 level.
ApeCoin Price Prediction: ApeCoin Price May Explode
For the ApeCoin price, parallel trade can only take over if the $4.5 subsidy is maintained at all costs. Currently, the technical indicator Relative Strength Index (14) is moving to cross the 40-level at the moment by sending bullish signals which can finally encourage more buyers to enter the market.
Meanwhile, if the 9-day MA crosses above the 21-day MA, the coin may continue to do well and the price could hit the resistance levels at $5.5, $6.0, and $6.5 respectively. Moreover, if the technical indicator decides to make a quick turn back to the lower side, there may be a quick bearish drop which may likely roll the market down to the support levels of $2.5, $2.0, and $1.5.
When compares with Bitcoin, ApeCoin is trading below the 9-day and 21-day moving averages as the price touches the daily high at 1927 SAT. However, for the fact that the market remains within the channel, the pair seems to be moving to cross above the moving averages.
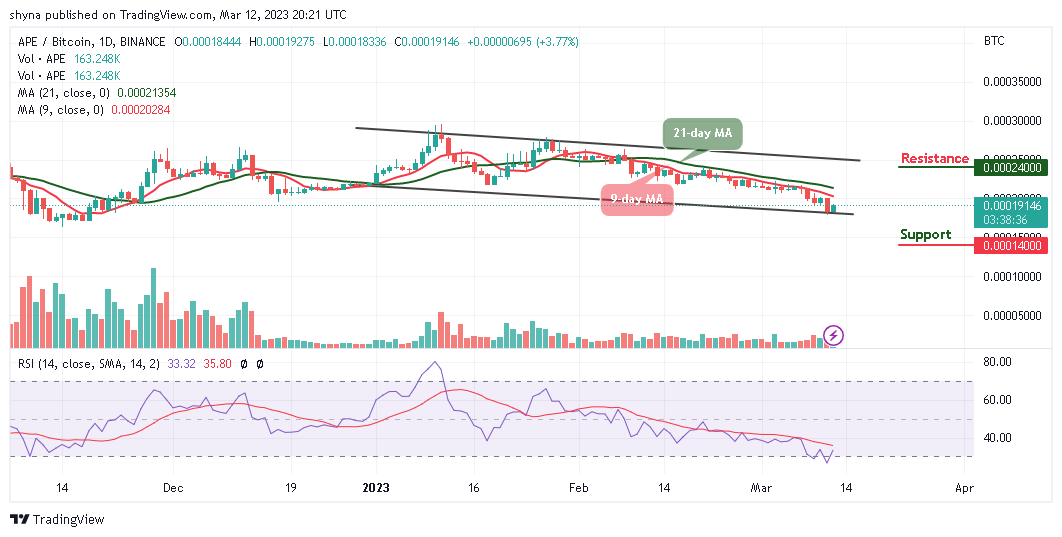
Moreover, if the buyers push the market price above the moving averages, APE/BTC may likely touch the resistance level of 2400 SAT and above. On the contrary, higher selling pressure may likely cancel the bullish pattern and this could attract new sellers coming into the market with the next focus on 1400 SAT and below while the technical indicator Relative Strength Index (14) remains below the 40-level.
Alternatives to ApeCoin
The ApeCoin price prediction shows that APE touches the resistance level of $0.41 as the coin prepares for another upward movement. Therefore, if APE/USD soars above the moving averages this could be a sign of sustainability and could result in a bullish continuation. Meanwhile, the FightOut token takes a giant step beyond the already-existing M2E in a number of ways. FightOut’s unique selling points mean it is likely to be a top crypto project in short order as about $6 million has been raised in the ongoing presale.
Join Our Telegram channel to stay up to date on breaking news coverage