

Join Our Telegram channel to stay up to date on breaking news coverage
ApeCoin (APE) price escaped a two-week-long downtrend on August 3, soaring 5.8% above the $1.85 support level. However, the $1.90 psychological level rejected the price, turning it toward the $1.8 demand zone. This price action has formed a bearish flag pattern that positions APE price for a 20% downward breakout to $1.48.
At the time of writing, ApeCoin was trading at $1.853, down 0.2% over the last 24 hours. The token’s 24-hour trading volume is 3.7% on the day to stand at $49.2 million, and the market capitalization has just increased 0.2% over the same timeframe, with evidence of reduced trading activity on the APE market.
ApeCoin Price Forms Bearish Flag Threatening More Losses
Following a lot of uncollected liquidity, around $1.766, the APE price reached a high of $2.17 on August 6. This came as bears waited to book profits on the recovery. However, the price corrected on August 7, declining almost 6% as it undid most of the ground gained the day before.
The ApeCoin price action since early August has led to a bearish flag pattern. This technical formation is negative, pointing to the continuation of the downtrend. The APE price action consolidates within the two parallel trend lines in the opposite direction of the downtrend. This is before breaking out and continuing to record lower lows.
At press time, APE is exchanging hands for $1.853. The price sat on immediate support at $1.83, embraced by the lower boundary of the flag. A daily candlestick close below this level will open the path for the ApeCoin price to target lower levels.
If this happens, it could clear the path for more losses for APE holders. Beyond that, the price would be $1.80 as the following possible line of defense. Breaching this level would set up the price to test the tip of the flag post at $1.732.
If selling momentum remains intact at this level, the price could drop further to reach the technical target of the prevailing chart pattern at $1.485. Such a move would have completed a 20% decline from current levels.
APE/USD Daily Chart
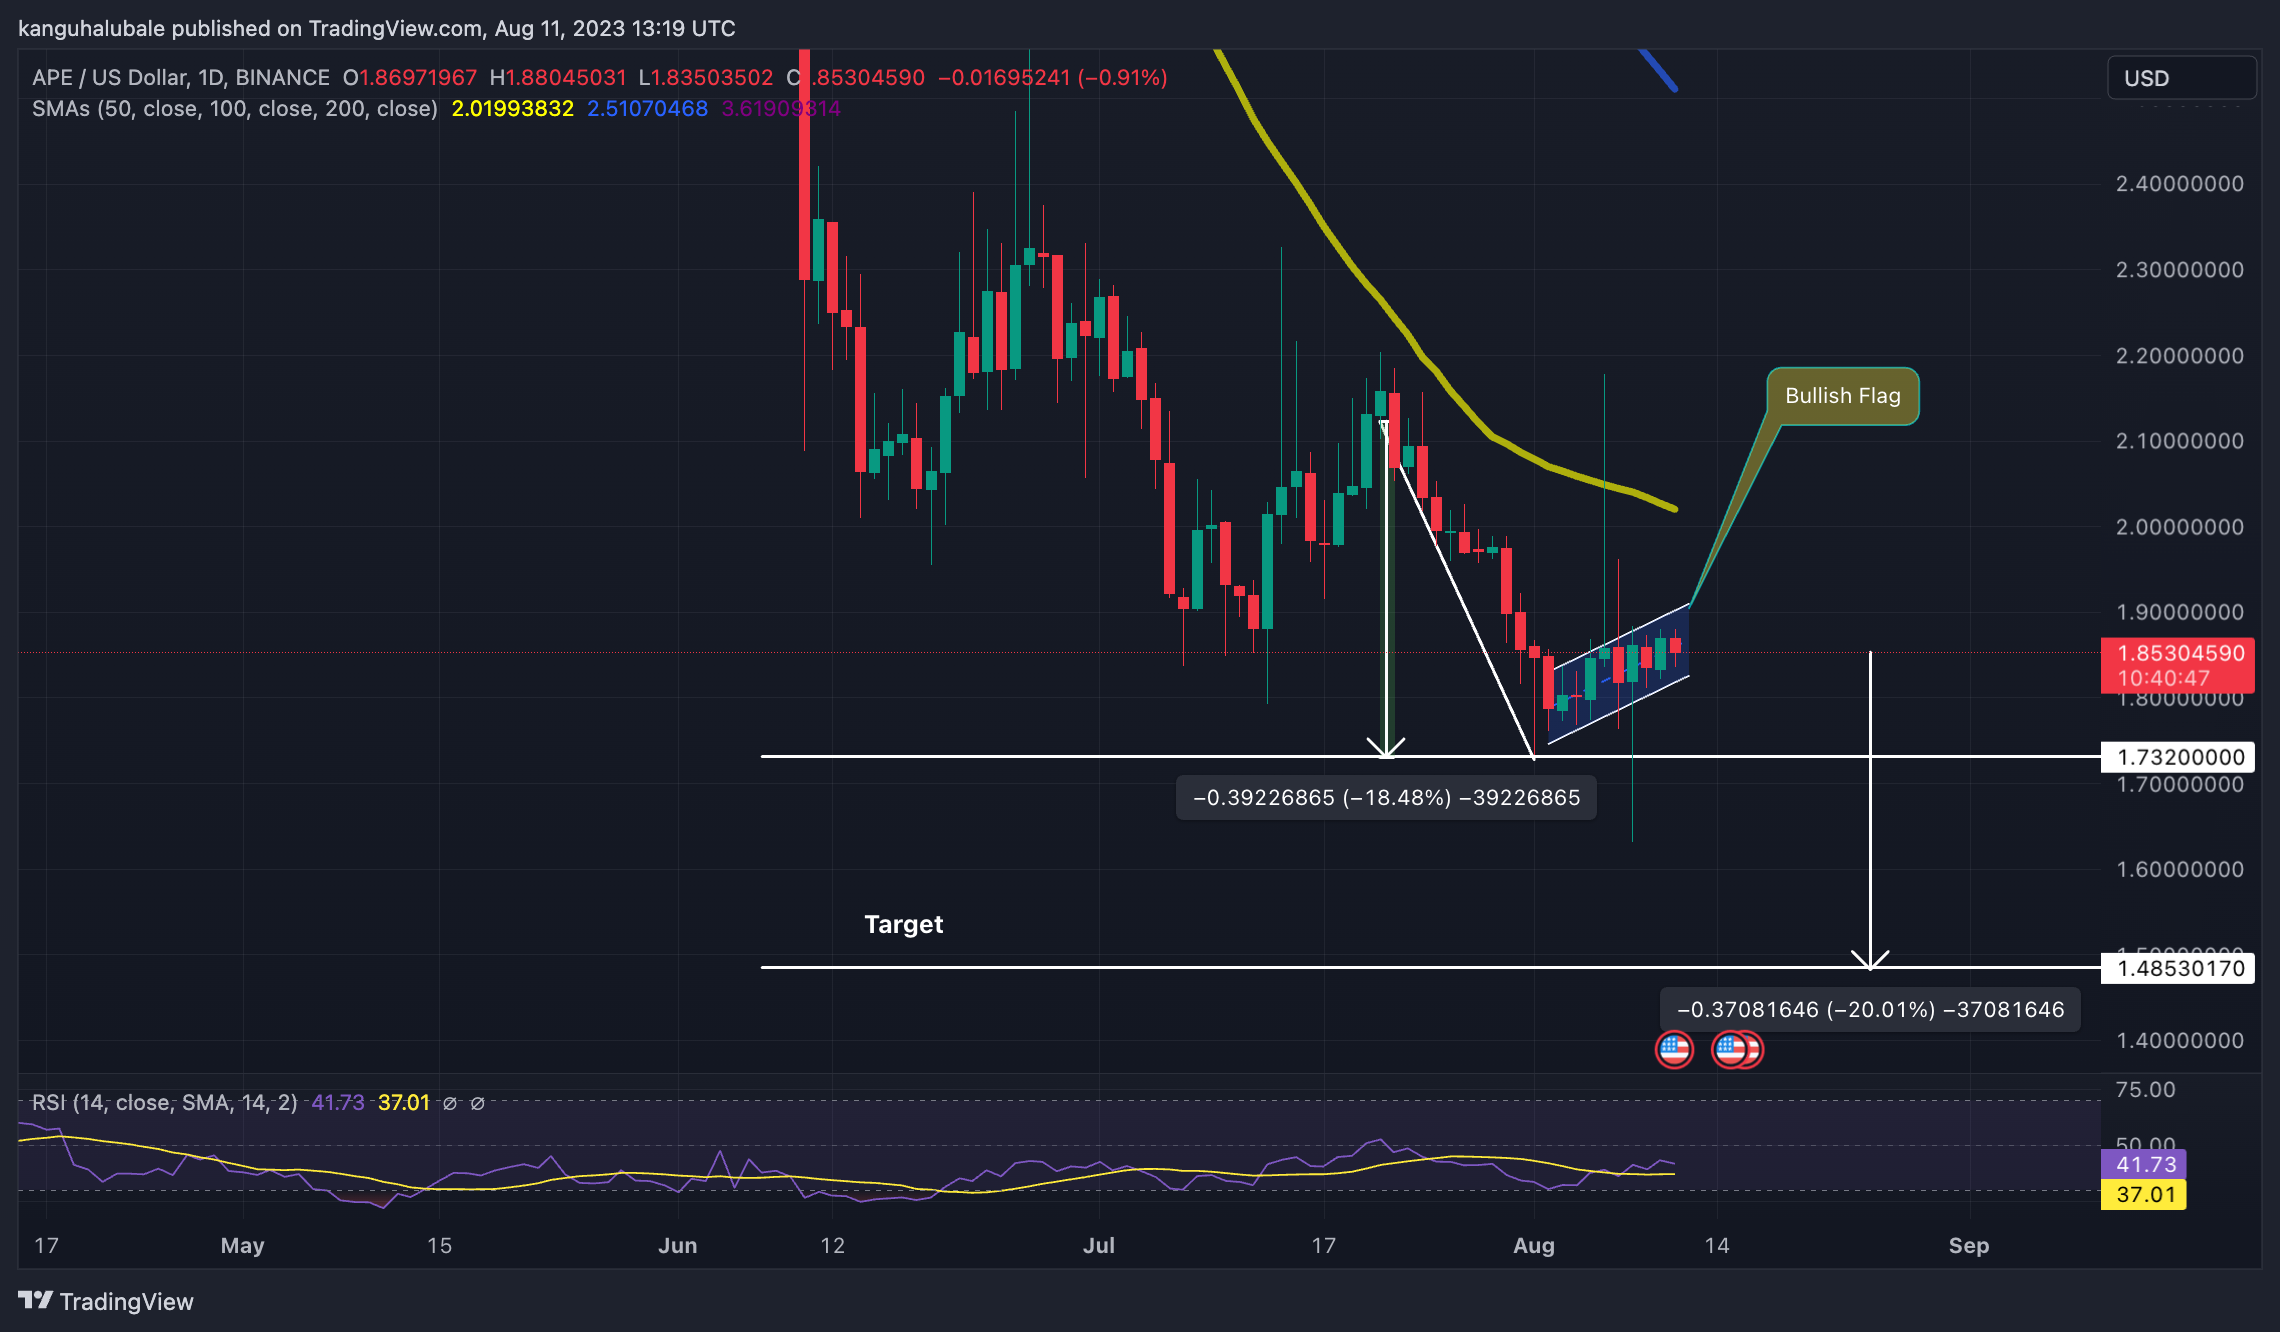
Several technical indicators supported APE’s downside. The Relative Strength Index (RSI) was facing downward. The price strength at 41 suggested the bears controlled the ApeCoin price.
In addition, the altcoin was moving below the 50-day Simple Moving Average (SMA) and the 100-day SMA. These supplier congestion zones were ideal roadblocks that could curtail any efforts to increase prices.
On-chain data from IntoTheBlock reinforced the stiffness of the barriers in Apecoin’s upward path. It’s In/Out of the Money Around Price (IOMAP) model showed that the price had relatively strong resistance northward, compared to the support it enjoyed downward.
The IOMAP chart below shows that the area with the 50-day SMA around $2.019 was within the $1.98 and $2.02 price range, where approximately 3.71 million APE were previously bought by 1,880 addresses.
ApeCoin IOMAP Chart
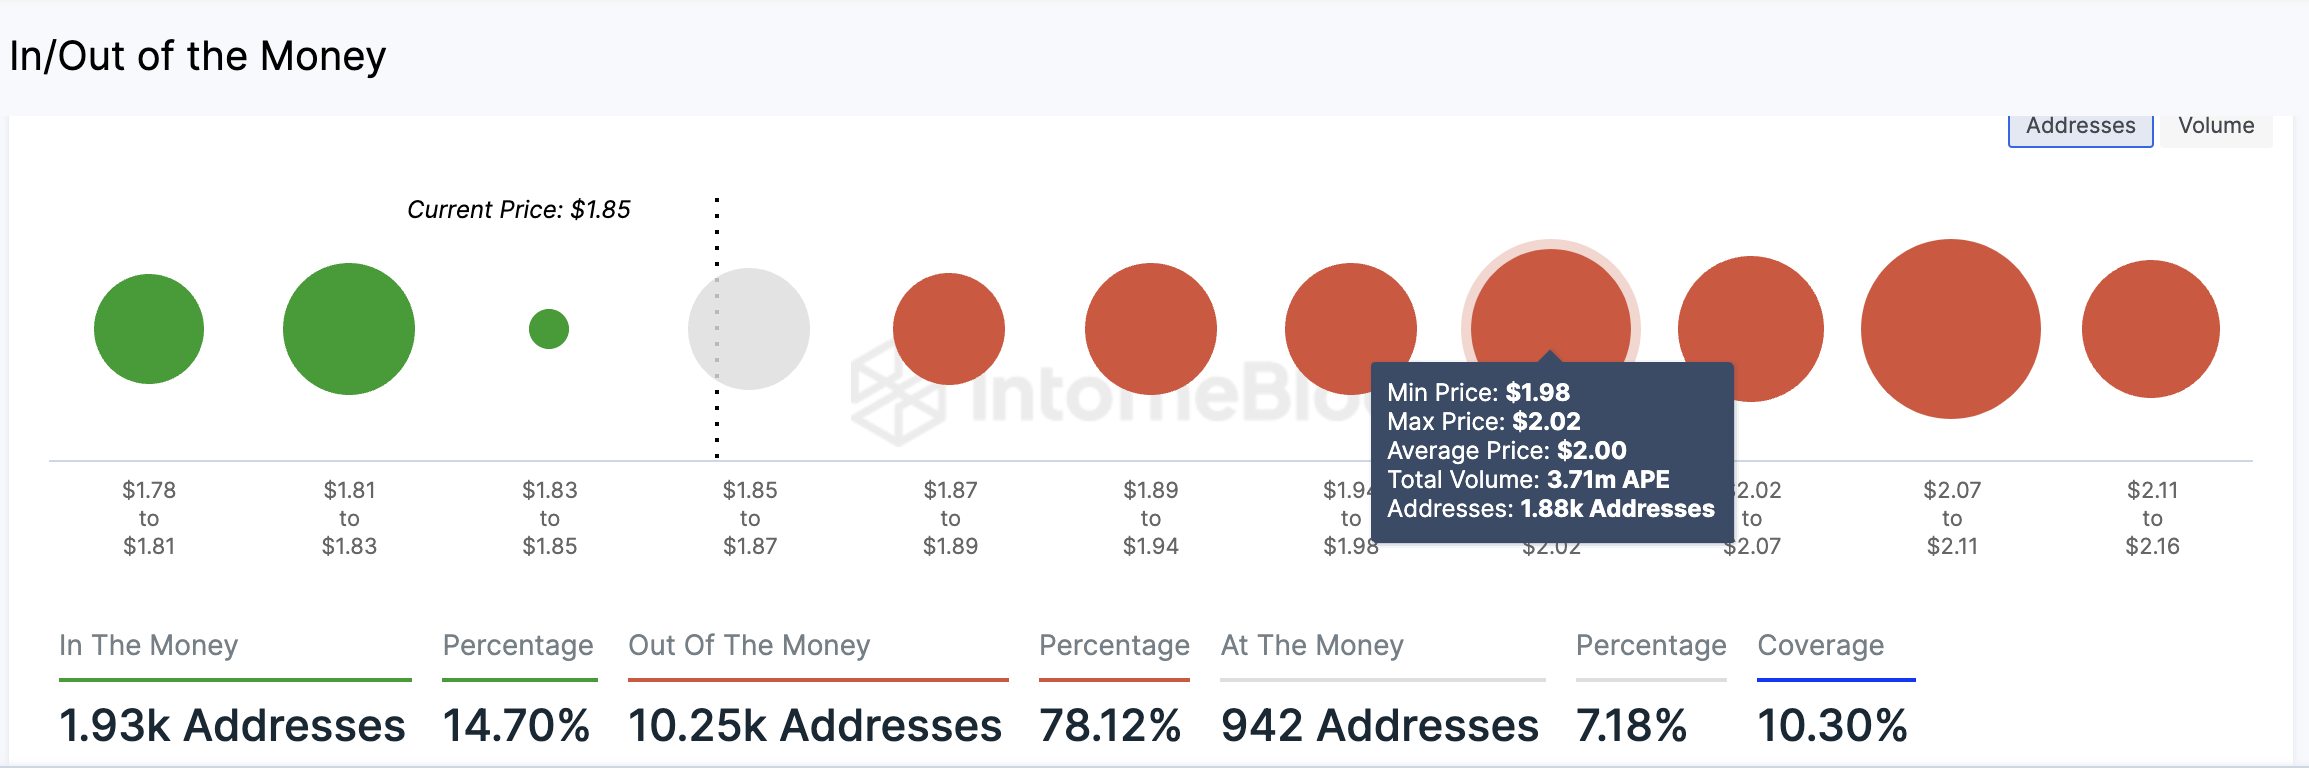
Any attempts to push the price above this level would be met by intense selling from this cohort of investors who may wish to break even.
Things may, however, go well for ApeCoin bulls if it rises above the upper boundary of the flag at $1.913 to escape from the bearish technical formation. If this happens, the crypto may grow to confront resistance from the $2.0 psychological level and the 50-day SMA at $2.019. Traders could expect APE’s upside to be capped here, given that the price has not traded above this dynamic resistance since mid-April.
APE Alternatives
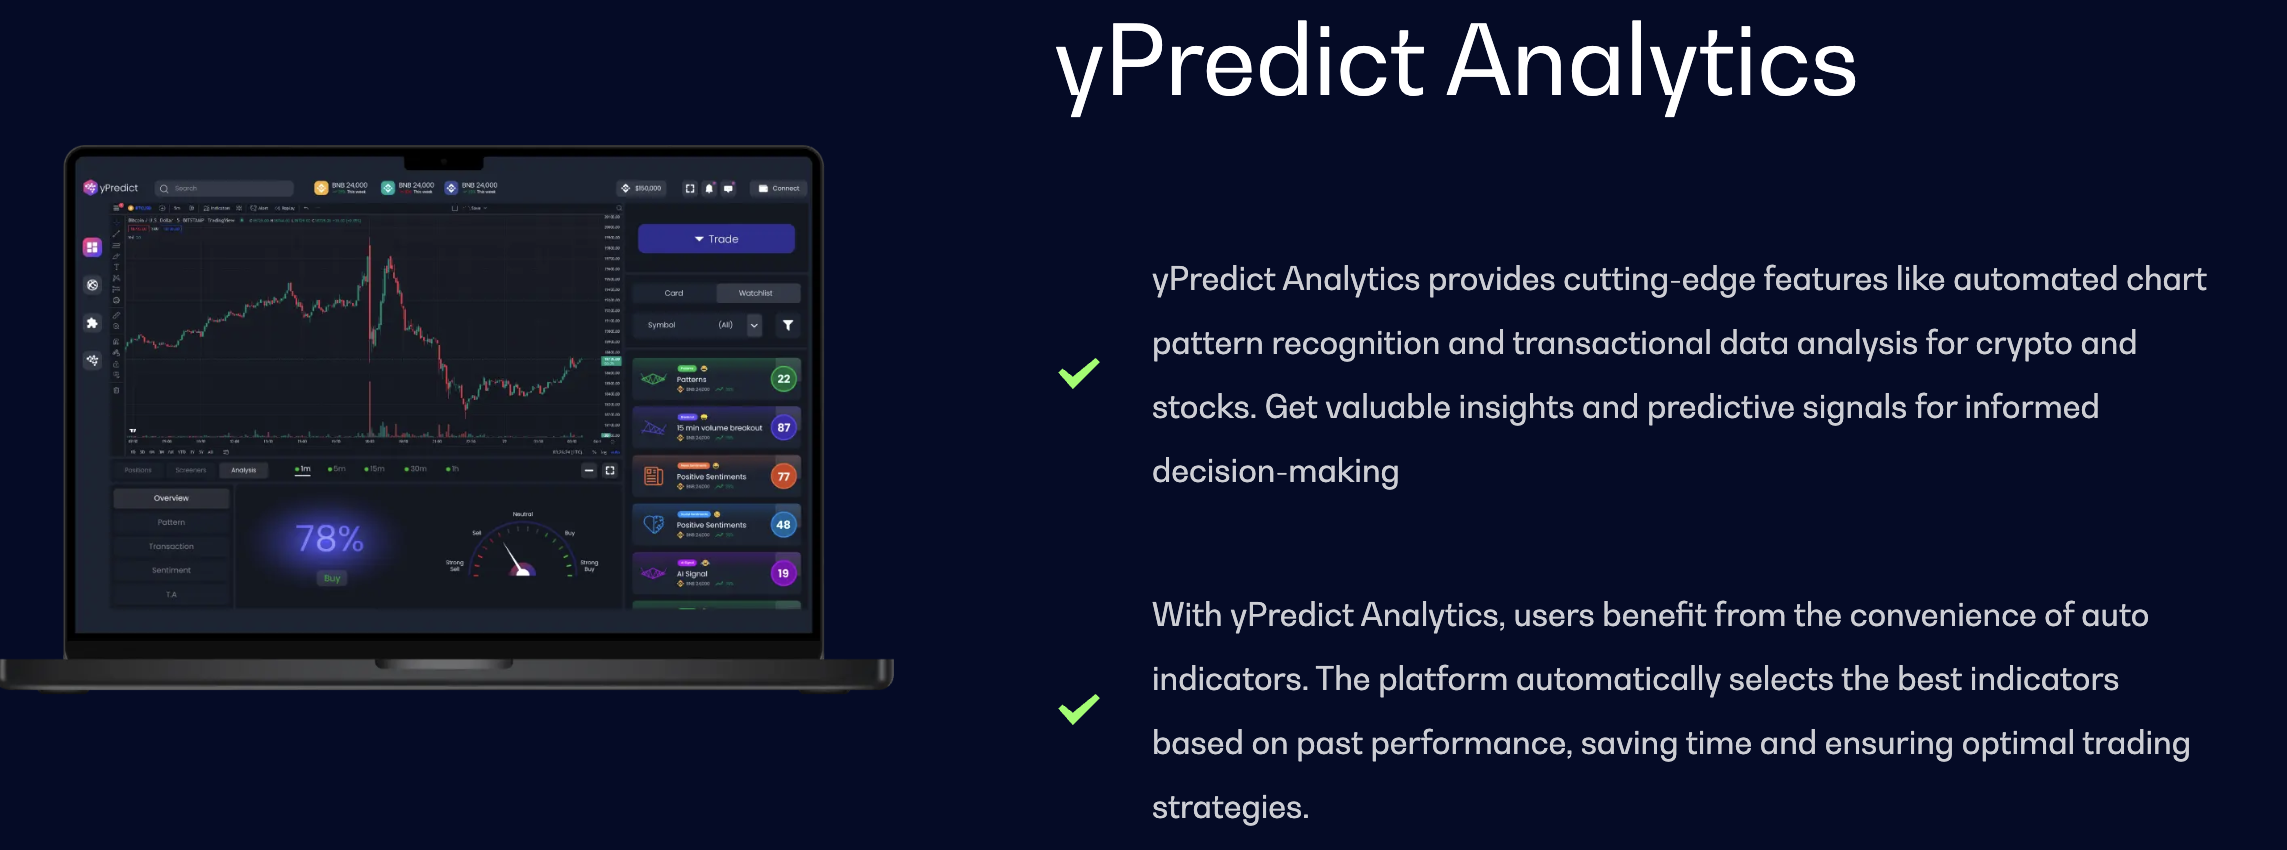
While we watch whether ApeCoin price will break out of the chart pattern, consider YPRED, the native token of the yPredict ecosystem. yPredict (YPRED) is a new ai-powered crypto, delivering a meticulously structured environment that equips traders with essential insights vital for thriving in the cryptocurrency market.
Built atop the Polygon network, this platform encompasses an array of AI-driven tools, including automated trading signals and the recognition of chart patterns. These resources prove advantageous for traders navigating the swift realm of crypto.
🚀📊 Empowering traders with comprehensive market analysis and AI-driven insights for informed crypto investment strategies. Trade smart with yPredict's predictive modeling and custom execution options. #YPRED #CryptoAI #SmartTrading https://t.co/xO9suqHbwF
— yPredict.ai (@yPredict_ai) August 7, 2023
At the time of writing, the project’s presale has garnered impressive funding surpassing $3.411 million, with an additional 20,000 individuals already enrolled on the project’s waitlist.
Visit yPredict here for more information on how you can participate in the presale.
Related News
- As APE Takes a Dip: Should Investors Shift Focus from ApeCoin to the Promising Shibie Coin?
- How to Buy yPredict Token – YPRED Presale
- Best Crypto to Buy Now August 7 – Algorand, yPredict, Cronos
Best Wallet - Diversify Your Crypto Portfolio

- Easy to Use, Feature-Driven Crypto Wallet
- Get Early Access to Upcoming Token ICOs
- Multi-Chain, Multi-Wallet, Non-Custodial
- Now On App Store, Google Play
- Stake To Earn Native Token $BEST
- 250,000+ Monthly Active Users
Join Our Telegram channel to stay up to date on breaking news coverage