


Join Our Telegram channel to stay up to date on breaking news coverage
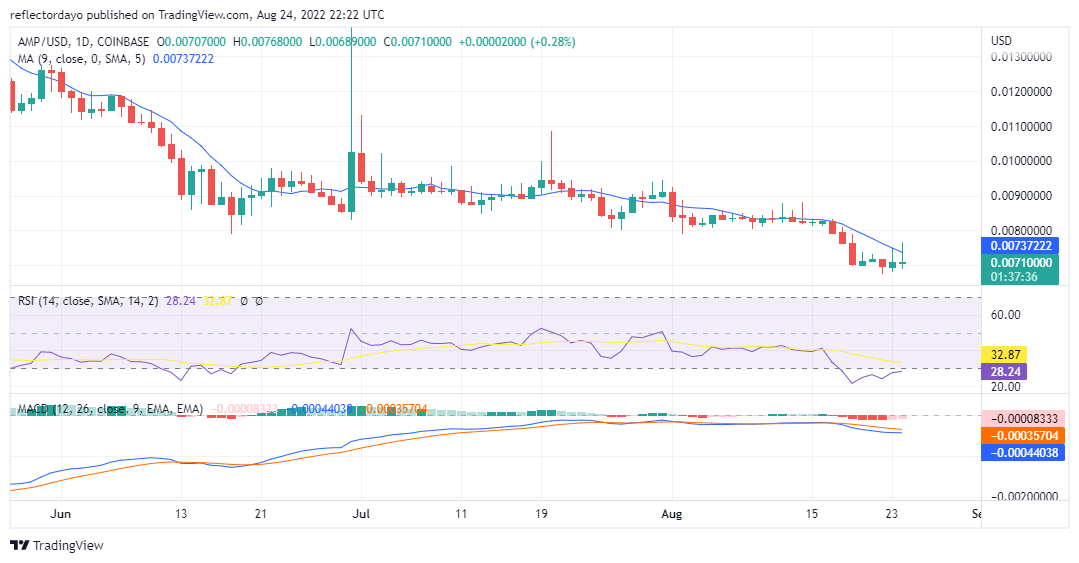
Since early August, the AMP/USD market has been ranging sideways. This is a significant weakness in the buying pressure and selling pressure. It shows a lack of interest on both sides of the demand and supply. Most of the trading sessions have closing prices that are very near the opening prices. This went on until the 17th of August when bears take the market. 18th and 19th were also bearish. After the price dropped down to a lower level of $0.00700571, another consolidation has continued till today.
Amp Price Statistic:
- Amp price now: $0.00720691
- Amp market cap: $ 302,147,260
- Amp circulating supply: 42.23Billion AMP
- Amp total supply: 99,213,408,535 AMP
- Amp coin market ranking:#109
Key Levels
- Resistance: $0.00760930, $0.00799896, $0.00827038
- Support: $0.00795422, $0.00763805, $0.00694822
Your capital is at risk
Amp Price Analysis: The Indicators Point of View
Although AMP/USD is a ranging market the market is trending down. When we look at the market in a broad view, we can see that the market is having lower highs. This signifies a downtrend. The market today is bullish, but bears push the price back down, closer to the area where the price opened. And though the bullish candle tested the 9-day moving average, it did not come near it. The RSI indicator line operates on the lower level, a sign of a downtrend. It crosses into the oversold zone since 19th
of August, but today, the indicator is about to cross out of the oversold region into the weak price zone. In the MACD, the lines are below the histogram. That is a downtrend market. The histograms are almost flat, they are closer to the zero point. Both the bullish histogram and the bearish histograms are almost flat. That is a sign of a ranging market. However, considering today’s histogram, it is pinkish. This is a sign of bullish activities to regain the market. But all the histograms are very small. The market may likely continue the trend.
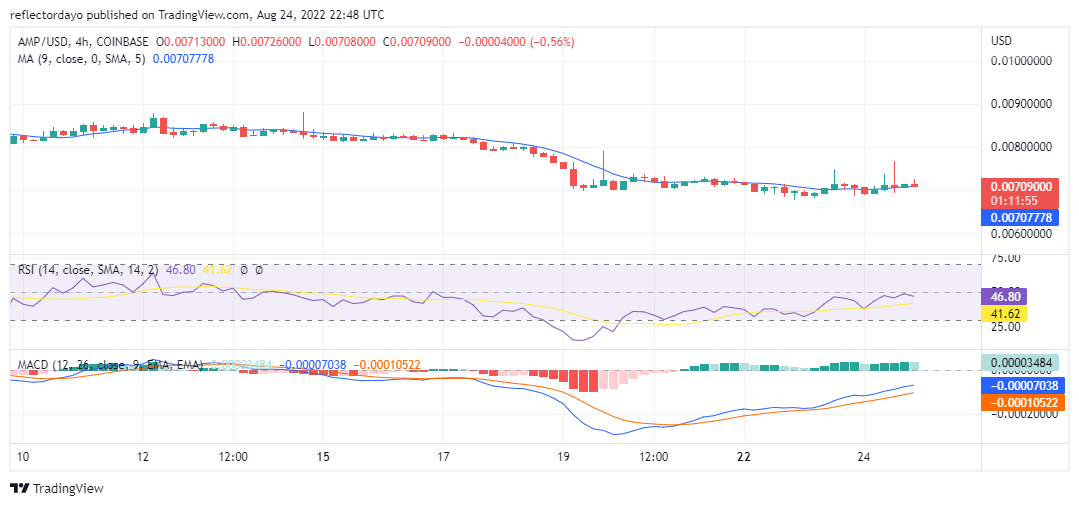
Amp Price Analysis: Amp/USD 4-Hour Chart Outlook
In this timeframe, the indicators are pointing to a bullish recovery, but the recovery is yet weak. The bullish activities are not as strong as to raise the price very high. But the RSI indicator is still pointing to a downtrend as it measures a strength of 46%
Related
Join Our Telegram channel to stay up to date on breaking news coverage