Join Our Telegram channel to stay up to date on breaking news coverage
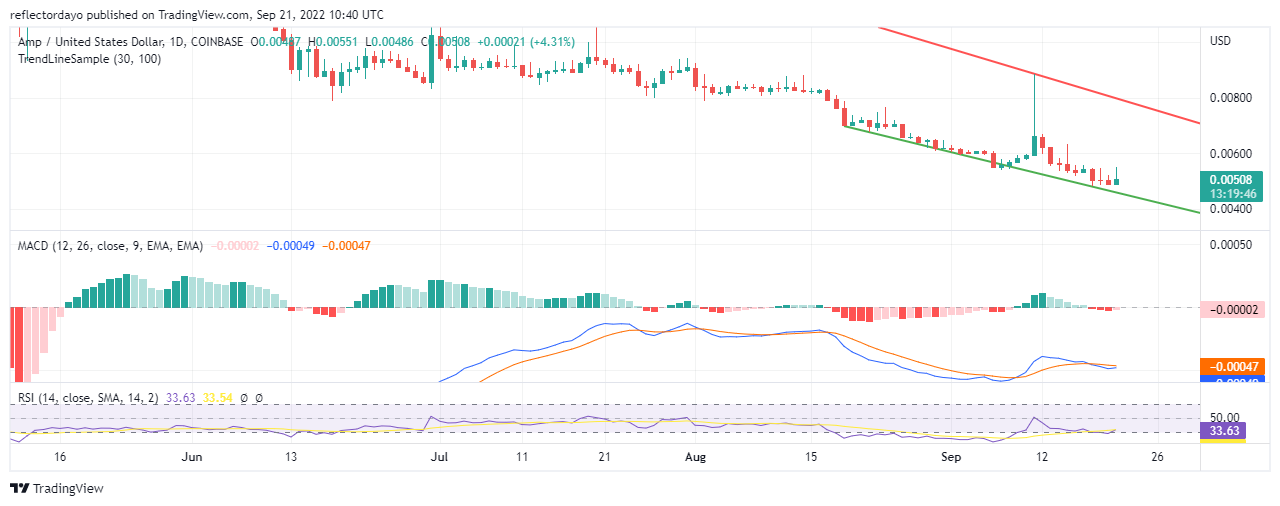
The price actions of AMP/USD are creating lower and lower support price levels. It is also creating lower and lower resistance levels. This shows that the market is going in favour of the sellers. However, the character of the bullish candlesticks with their longer upper wicks or shadows shows that buyers are also mounting pressure, but they are not strong enough to maintain push price level up.
Amp Market Price Statistic:
- AMP/USD price now: $0.00511
- AMP/USD market cap: $216,046,856.93
- AMP/USD circulating supply: 42,222,702,186
- AMP/USD total supply: 99,213,408,535
- AMP/USD coin market ranking: #128
Key Levels
- Resistance: $ 0.00532, $0.00550, $0.00575
- Support: $0.00487, $0.00470, $0.00450
Your capital is at risk
Amp Market Price Analysis: The Indicators’ Point of View
Between yesterday and today’s trading session, a bullish engulfing candlestick pattern formed on the chart. This candlestick pattern means that the buyers are becoming stronger. However, in this market, buyers continue to fail to keep their hold on the market. They make an impressive move to take the market, but they soon lose hold of it as sellers mount pressure on the market. In the MACD indicator, the two lines are going together on a horizontal pattern. Bullish momentum and bearish momentum are matching up. As a result of this, the price is balancing, for now, at the current price. This is making the bearish histogram turn pink. That is a sign that selling pressure is waning to give room for buying pressure. But how far can the bulls go with their insufficient pressure?
Amp: AMP/USD 4-Hour Chart Outlook
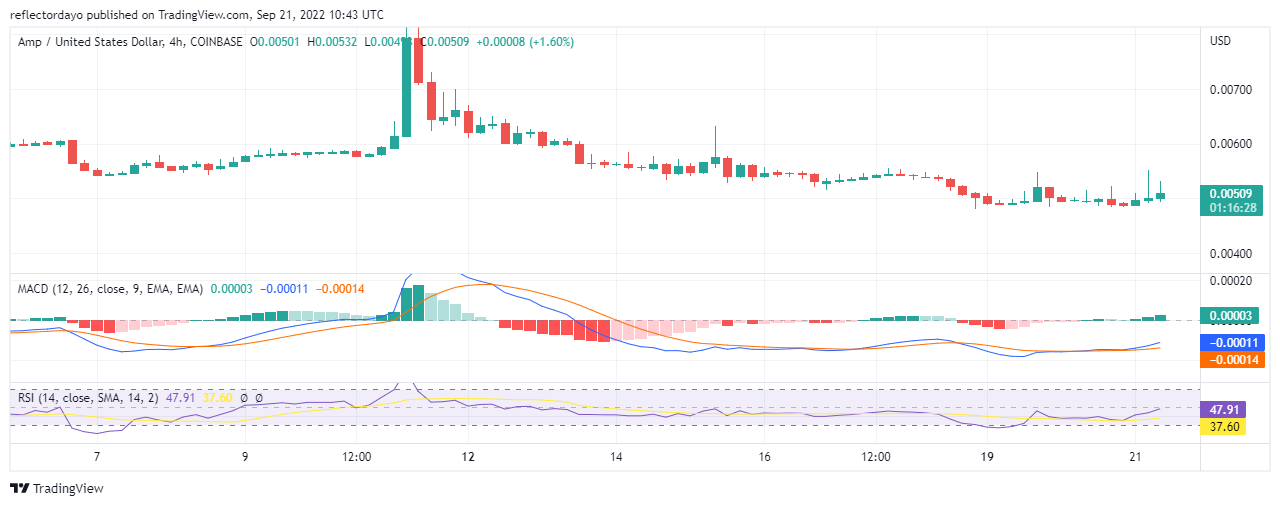
Between yesterday’s last 4-hour session and today’s first 4-hour session, a bullish engulfing candlestick formed. And this signified that a bullish market behaviour is to follow. And that is what happened. The first three sessions of the day have been bullish. But, much of the land covered by the bulls was lost to the bears in the market struggle. However, the indicators are still in favour of a bullish recovery, the RSI line has reached 47.91%. The market strength is still below the 50% demarcating border for the strong and weak market zone. Judging by the general trend of the market, the bullish recovery may not last for too long and the bearish trend may resume soon.
Related
Join Our Telegram channel to stay up to date on breaking news coverage
