

Join Our Telegram channel to stay up to date on breaking news coverage
AMZN/USD
From last Thursday when you could buy Amazon stock at $1823.77 at its highest point, which is the highest price has been since from October last year, we have seen a decrease of 4.11% measured to the lowest point the price has been on today’s open which is at $1749.31.
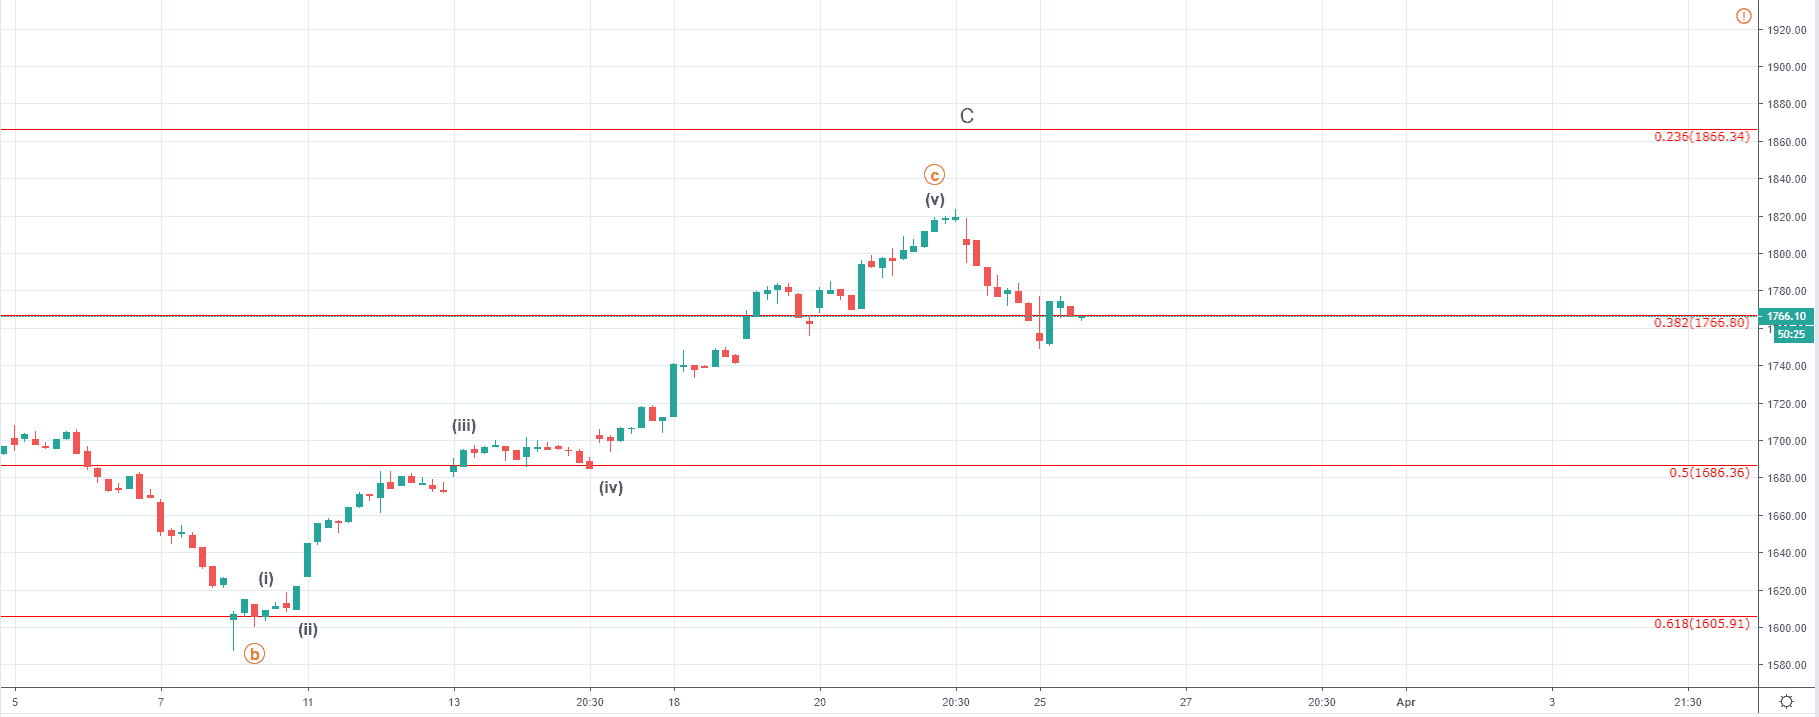
Looking at the hourly chart, you can see that the price has fallen below the 0.382 Fibonacci level today which serves as a support on the way up and is currently retesting it from the downside for resistance.
As the price previously ended its five-wave move to the upside we are most likely seeing the first wave of the higher degree structure to the downside. This structure could be impulsive or it could be another three-wave correction but considering that the price of Amazon increased by 13.67% in just over 13 days now we are going to see a retracement.
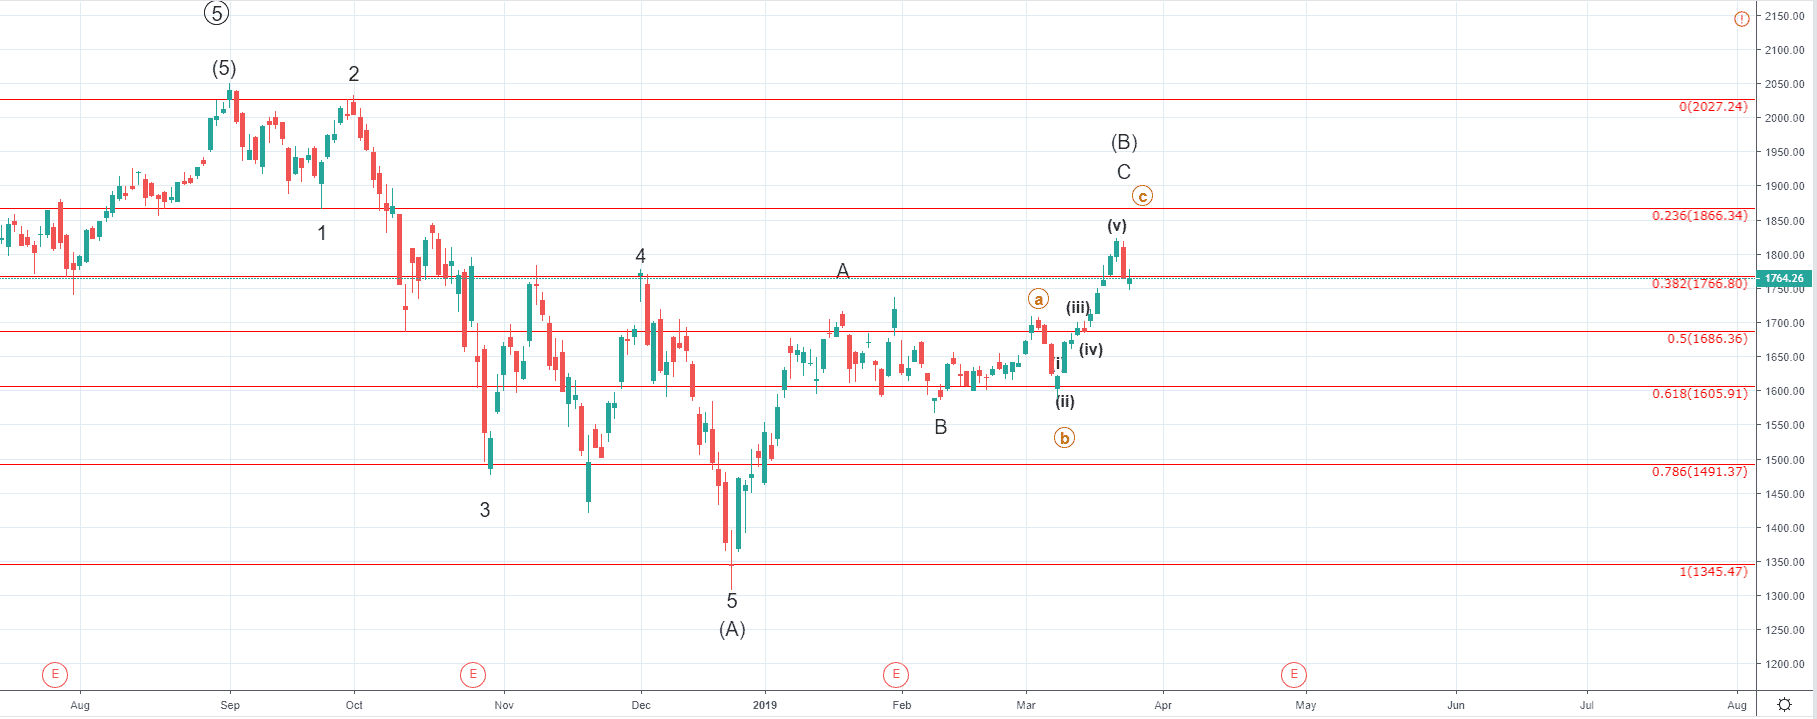
Zooming out on to the daily chart, we can see that the price of Amazon most likely ended its three-wave correction to the upside after a five-wave impulsive move to the downside has been made from the all-time high at $2050 to around $1311.88 at its lowest point on 24th of December.
The price managed to recover by slightly over 38% from there to the yearly high at $1823.77 almost reaching the 0.236 Fibonacci level but fell below the 0.382 which served as significant resistance point and was well respected in the past.
Now that the three-wave correction to the upside ended the decrease we have seen from the last Thursday could be the start of the C wave from the ABC correction of a higher degree that started after the price of Amazon reached its all-time high.
The other possibility would be that the ABC correction to the upside was the 2nd wave of a higher degree impulse to the downside which we are going to validated further down the line, but in either way, I would be expecting a bearish period for the Amazon.
Zooming out further on to the weekly chart, you can see that the price of Amazon has been increasing in a five-wave manner until 4th of September when the all-time high was reached which is why we are now seeing a correction taking place.
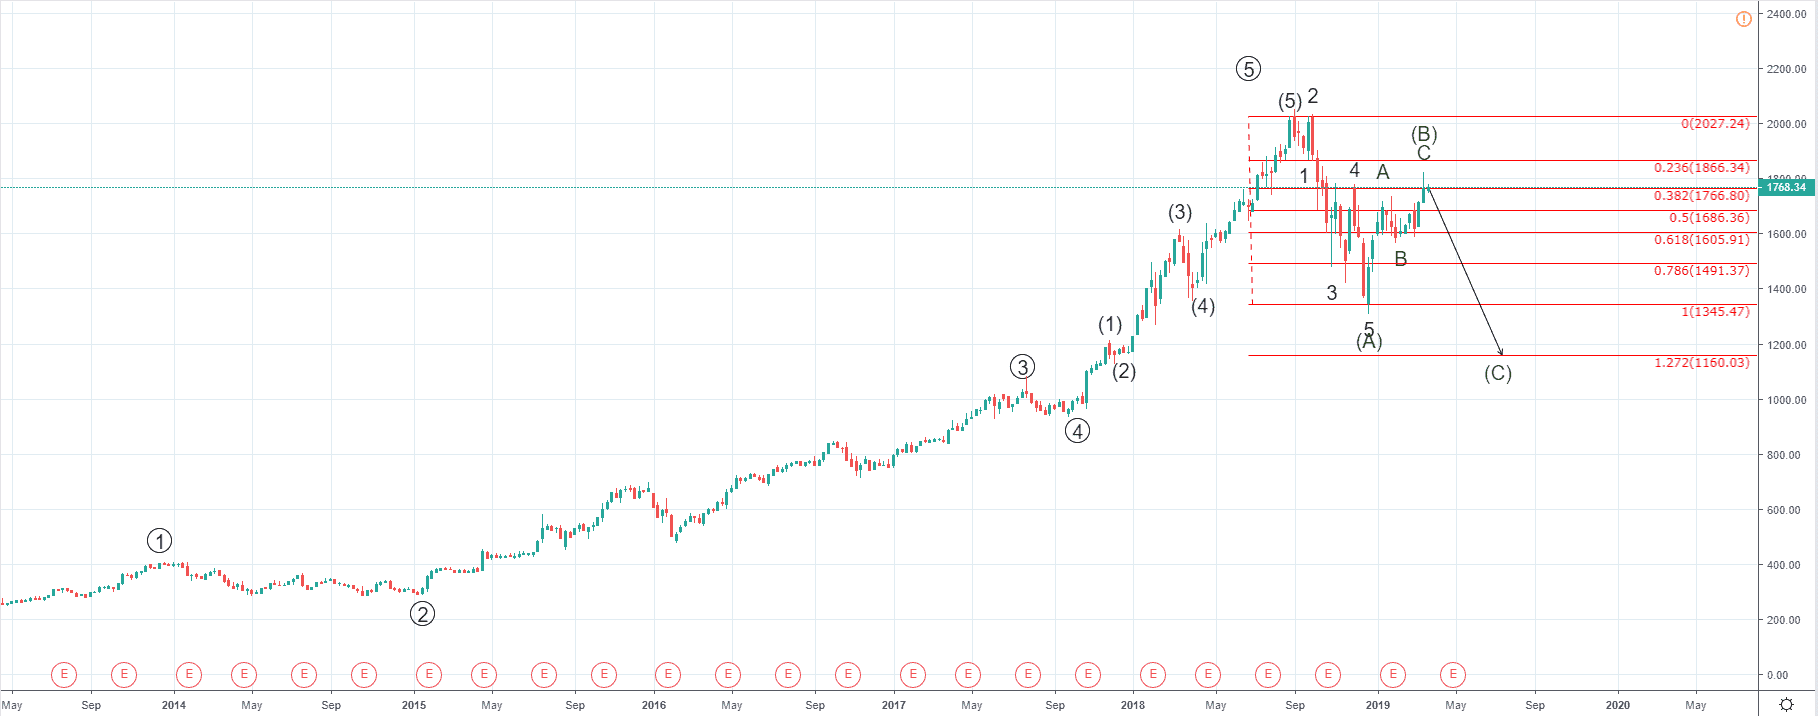
If the price of Amazon ended its five-wave impulse the now expected correction could extend for quite some time, even forming further corrective structures and sideways movement which would end around the same levels to where the initial decrease was made at around $1345 but ultimately I would expect to see the price fall even lower in which case I would be looking at the 1.272 Fibonacci level at $1160 for the ending point.
If we have seen the end of the impulsive increase to the upside the correction that is set to occur could extend to even lower levels then currently projected but more on that in due time.
Join Our Telegram channel to stay up to date on breaking news coverage