
Join Our Telegram channel to stay up to date on breaking news coverage
The Algorand price prediction shows that ALGO faces the north as the technical indicator Relative Strength Index (14) moves to the upside.
Algorand Market Price Statistic:
- Algorand price now: $0.17
- Algorand market cap: $1.23 billion
- Algorand circulating supply: $7.1 billion
- Algorand total supply: $7.3 billion
- Algorand coin market ranking: #32
ALGO/USD Market
Key Levels:
Resistance levels: $0.30, $0.32, $0.34
Support levels: $0.09, $0.07, $0.05
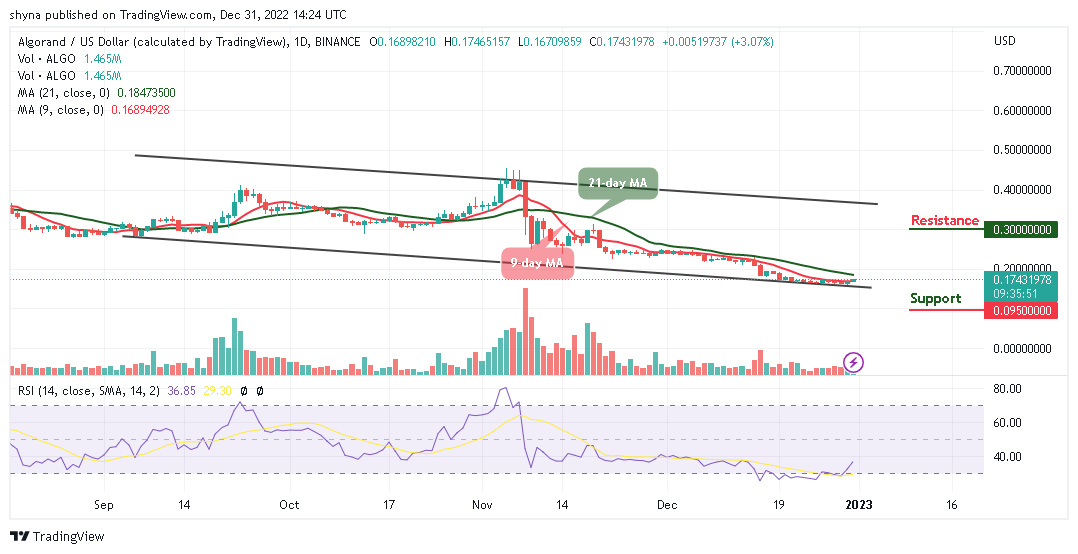
ALGO/USD is currently trading around $0.17 and once it manages to cross above the 9-day and 21-day moving averages, the next target could be located at $0.20 which is the crucial level for the coin. However, a push from here could send the price straight to around $0.0.25 while the daily low could be spotted at the $0.15 support level. Meanwhile, if the current level fails to hold strong, the Algorand (ALGO) could slip below the 9-lower boundary of the channel.
Algorand Price Prediction: Would Algorand Spike to the Upside?
The Algorand price is now facing the uptrend as the coin moves to cross above the 21-day moving average. Therefore, if the buyers can put more effort and push the market price towards the upper boundary of the channel, ALGO/USD could hit the resistance levels of $0.30, $0.32, and $0.34 respectively.
On the contrary, a break below the lower boundary of the channel may bring the coin toward the critical supports at $0.09, $0.07, and $0.05. Looking at the technical indicator Relative Strength Index (14), Algorand may begin to follow an upward trend as the signal line moves to cross above the 40-level, suggesting that the coin may trade bullishly.
When compares with Bitcoin, the Algorand price is attempting to cross the 9-day and 21-day moving average to hit the nearest resistance at 1100 SAT. Meanwhile, unless this resistance effectively holds and the price ends up closing above it, there might not be any reason to expect a long-term bullish reversal.
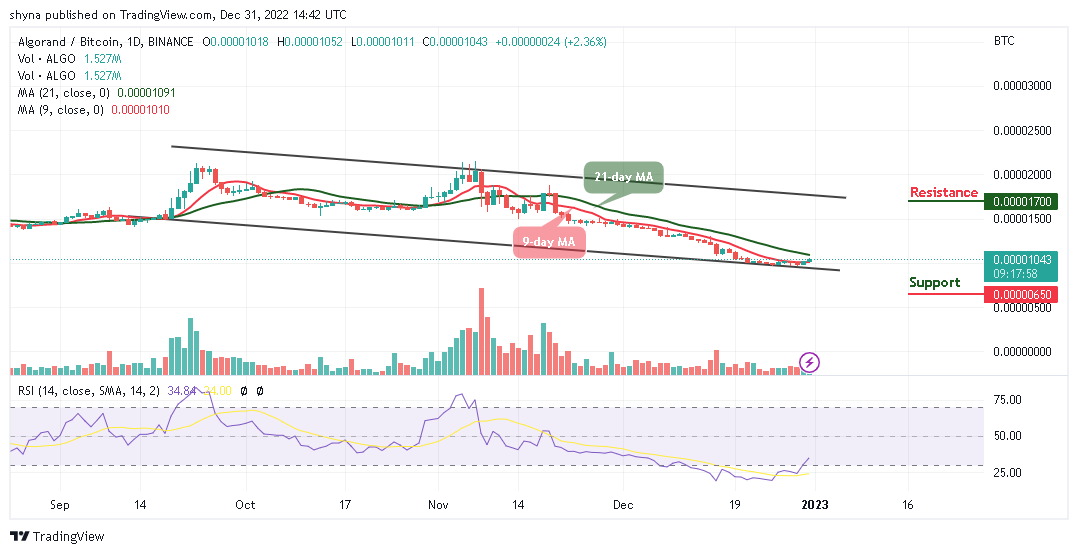
However, if the bears bring the coin below the lower boundary of the channel, it could refresh low under 1000 SAT, while a possible bearish continuation may hit the support at 650 SAT and below. Moreover, if the Algorand price crosses above the 21-day MA, heading toward the upper boundary of the channel could hit the potential resistance at 1700 SAT and above. The technical indicator Relative Strength Index (14) also confirms the bullish movement as the signal line moves to cross above the 40-level.
However, Dash 2 Trade gives you the ability to optimize your trading and speculative profitability with effective crypto trading recommendations, auto trading, and analytics features. There is a D2T token presale ongoing and time is running out. The presale dashboard launch is coming soon since the product dev is ahead of the schedule. So far, the presale has raised almost $12 million.
Related
Join Our Telegram channel to stay up to date on breaking news coverage