
Join Our Telegram channel to stay up to date on breaking news coverage
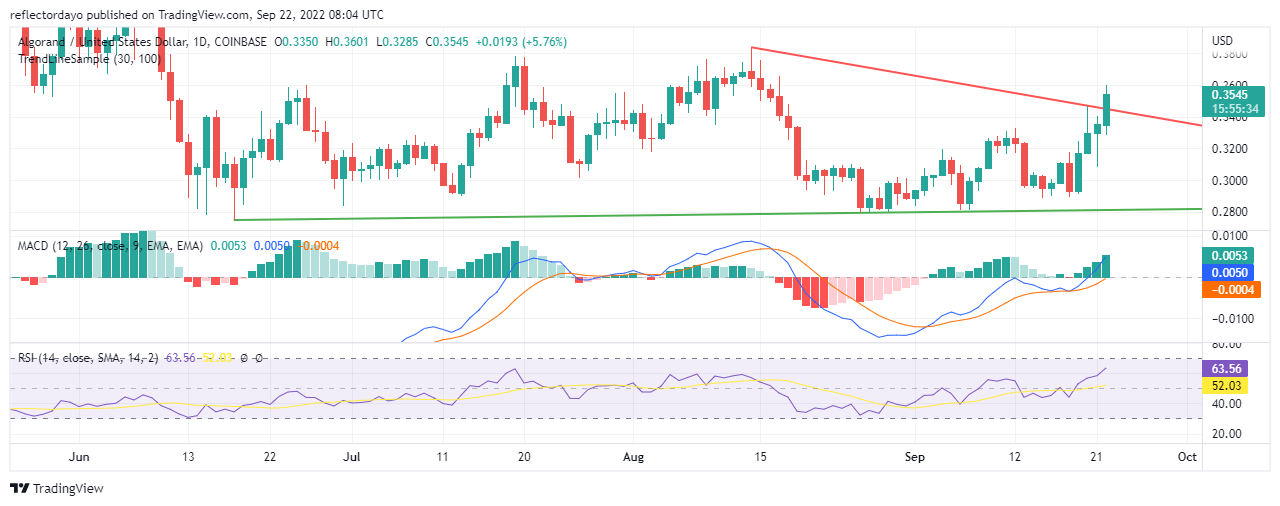
The very bullish market trend o ALGO/USD has broken through the upper trend line and heading towards the $0.3600 resistance level. This market has gone the way we predicted earlier. We have spotted a falling wedge triangle candlestick pattern on the chart. That means an imminent bullish reversal trend. The market is now in a bullish trend and the bullish pressure is stronger than the selling pressure even though the selling pressure is also formidable.
Algorand Market Price Statistic:
- ALGO/USD price now: S0.3526
- ALGO/USD market cap: $2,449,484,273
- ALGO/USD circulating supply: 6,931,210,232
- ALGO/USD total supply: 10,000,000,000
- ALGO /USD coin market ranking: #29
Key Levels
- Resistance: $ 0.3600, $0.3750, $0.40000
- Support: $0.3171, $0.30000, $0.2741
Your capital is at risk
Algorand Market Price Analysis: The Indicators’ Point of View
After the market found the new slightly higher support levels at 0.2922 on the 19th of September, the market began to rally to upper price levels day by day. It continued to move higher for four consecutive days. But, within those days of a bullish market, we can yet feel the strong down push of price by the sellers. Examples of such can be seen yesterday and on the 20th of September. The long wick below and above those candlesticks testifies to the formidability of the sellers
In the MACD indicator, the histograms show strong buying as they are green and very progressive in performance. The two indicating lines of the MACD have now crossed above point zero. This is the second test to confirm the bullish trend as the market is crossing out from below the equilibrium point (that is the bearish zone). The character of the histograms gives the impression that this bullish move will continue.
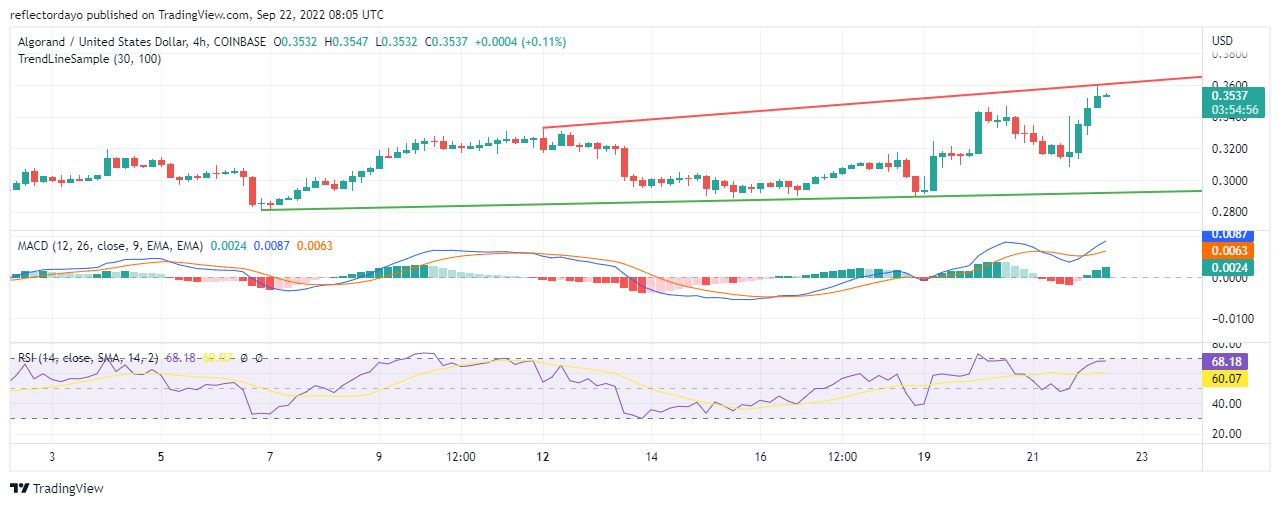
Algorand: ALGO/USD 4-Hour Chart Outlook
The market has gone in favour of the bulls since the day trading session begins, even though sellers are putting pressure to influence the direction of the market. But with the looks of the RSI, the momentum of the RSI line is reducing and the line is now ranging at around 68%. This is in response to bearish resistance.
Related
Join Our Telegram channel to stay up to date on breaking news coverage