
Join Our Telegram channel to stay up to date on breaking news coverage
Bitcoin experienced one of its most severe crashes in 2022, with the BTC price falling below $20,000 since June of this year, after peaking at $68,000 in 2021.
However, the current market sell-off does not imply that Bitcoin crashes and bear markets will be limited to 2022. Since the first Bitcoin block, or the genesis block, was mined in January 2009, Bitcoin has seen its fair share of crypto winters.
As we zoom out on the Bitcoin price chart, we notice five of the most notable price drops in the cryptocurrency’s history.
Bitcoin’s price plummeted from $32 to $0.01 in 2011
20 months to retest previous high: (June 2011–February 2013)
Bitcoin’s price broke its first major psychological barrier of $1 in late April 2011, launching its first-ever rally to $32 on June 8, 2011. But the happiness didn’t last long, as Bitcoin’s value dropped to $0.01 in a matter of days.
The sharp drop was largely attributed to security issues at Mt. Gox, a now-defunct Japanese crypto exchange that traded the majority of Bitcoin at the time. A security breach on the exchange’s platform resulted in the theft of 850,000 BTC, raising serious concerns about the security of Bitcoin stored on exchanges.
Bitcoin’s June 2011 flash crash became a significant part of Bitcoin history, with BTC losing nearly 99% of its value in a matter of days. The event began a long time before the BTC price recovered to its previous high of $32 and only reached new highs in February 2013.
When compared to more recent charts, it’s difficult to track the pre-2013 Bitcoin price. CoinGecko and CoinMarketCap, two popular price tracking services and websites, do not track Bitcoin prices prior to April 2013.
“Bitcoin was in its infancy prior to 2013, and there weren’t that many places trading Bitcoin back then,” CoinGecko chief operating officer Bobby Ong explained. He also stated that CoinGecko has not received many requests for pre-2013 data, so it is low on the platform’s priority list.
Second bear market: Bitcoin falls from $1,000 to under $200 in 2015
37 months to retest previous high: (November 2013–January 2017)
Bitcoin reached $100 in mid-April 2013, according to BTC price data, and then surged to briefly reach $1,000 in November 2013.
After breaking $1,000 for the first time in history, Bitcoin entered a massive bear market, with the BTC price falling below $700 one month later. The price drop coincided with the Chinese central bank’s decision in late 2013 to prohibit local financial institutions from handling Bitcoin transactions.
Over the next two years, the cryptocurrency fell further, reaching a low of $170 in January 2015 after reaching a low of around $360 in April 2014.
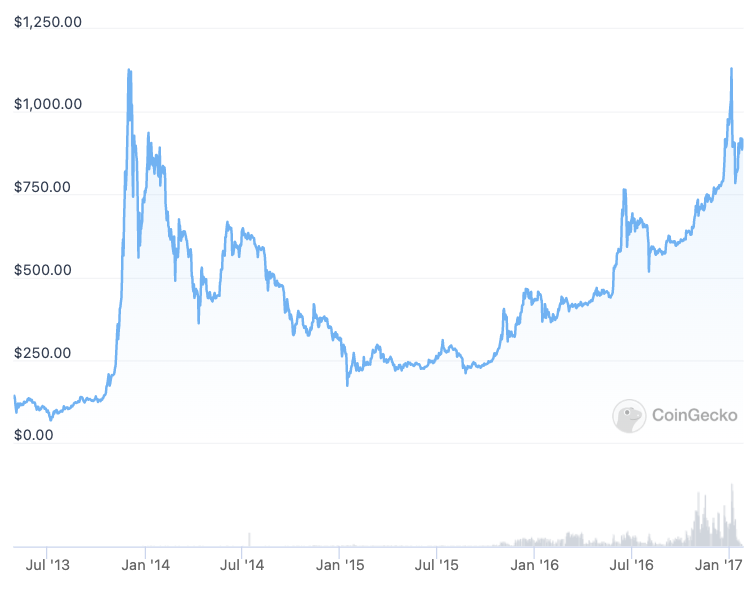
Bitcoin price graph from April 2013 to January 2017
The 2014 cryptocurrency winter became synonymous with the hacked Mt. Gox crypto exchange, which halted all Bitcoin withdrawals in early February 2014. The platform then ceased all trading and declared bankruptcy in both Tokyo and the United States.
Some major financial institutions have also expressed concerns about Bitcoin, with the US Commodity Futures Trading Commission claiming in late 2014 that it had authority over “Bitcoin price manipulation.”
The general perception of Bitcoin was primarily negative until August 2015, when the trend began a long-term reversal. Despite the strong bullish market, Bitcoin eventually returned to $1,000 in January 2017. This was the longest all-time high price recovery period in Bitcoin history.
Third bear market: Bitcoin falls below $3,200 after reaching $20,000 in December 2017
36 months to retest previous high: (December 2017–December 2020)
After regaining $1,000 in January 2017, Bitcoin continued to rise, reaching as high as $20,000 by the end of the year.
However, like Bitcoin’s previous historical peak of $1,000, the triumph of $20,000 was fleeting, as Bitcoin dropped and lost more than 60% of its value in a matter of months.
The year 2018 was quickly dubbed “crypto winter” as the Bitcoin market continued to contract, with BTC reaching a low of around $3,200 in December 2018.
Security issues on Coincheck, another Japanese cryptocurrency exchange, kicked off the crypto winter. Coincheck was hacked in January 2018, resulting in a loss of approximately $530 million in NEM (XEM) cryptocurrency. In March and June of this year, tech behemoths like Facebook and Google banned ads for initial coin offerings and token sales on their platforms, respectively.
Global crypto regulation efforts also contributed to the bear market, with the Securities and Exchange Commission rejecting applications for Bitcoin ETFs.
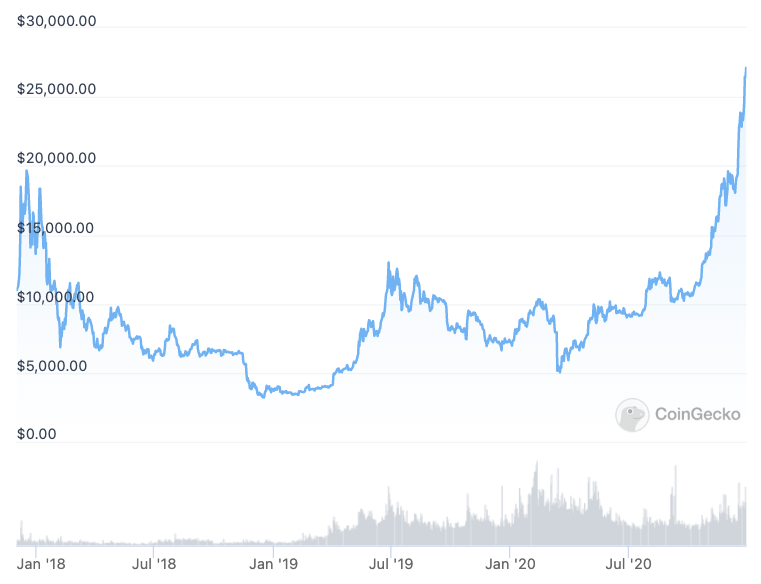
Bitcoin price graph from December 2017 to December 2020
Fourth bear market: Bitcoin falls from $63,000 to $29,000 in 2021.
Six months to retest previous high: (April 2021–October 2021)
Bearish sentiment dominated the cryptocurrency market until 2020, when Bitcoin not only returned to $20,000 but also began a massive bull run, peaking at more than $63,000 in April 2021. Despite 2021 becoming one of the most important years for Bitcoin, with the cryptocurrency surpassing a $1 trillion market cap, the cryptocurrency suffered a minor setback.
Bitcoin retreated slightly after setting new all-time highs in mid-April, with its price eventually falling to as low as $29,000 in three months. The 2021 mini-bear market occurred amid a growing media narrative suggesting that Bitcoin mining has environmental, social, and corporate governance issues (ESG).
The global ESG-related FUD surrounding Bitcoin was exacerbated even further when Elon Musk’s electric car company Tesla dropped Bitcoin as payment in May, citing ESG concerns. Only three months later, Musk admitted that renewable energy powered roughly half of Bitcoin mining.
Despite China’s major crackdown on local mining farms, the bear market did not last long. By the end of July, the bullish trend had resumed, with Bitcoin eventually surging to its still-unbroken all-time high of $68,000 set in November 2021.
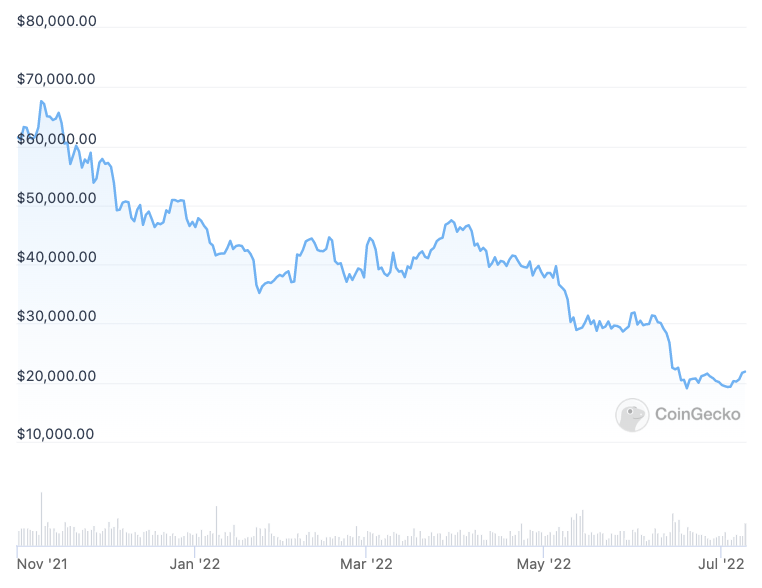
Fifth bear market: Bitcoin falls from $68,000 to under $20,000 in 2022.
Time to retest previous highs: Bitcoin failed to break $70,000 and began to fall in late 2021
Since November of last year, the cryptocurrency has been in a bear market, with one of its largest historical crashes in 2022.
In June, the cryptocurrency fell below $20,000 for the first time since 2020, fueling market panic.
The ongoing bear market is largely due to the crisis of algorithmic stablecoins, specifically the TerraUSD Classic (USTC) stablecoin, which are designed to support a stable 1:1 peg with the US dollar using blockchain algorithms rather than equivalent cash reserves.
In May, USTC, a major algorithmic stablecoin, lost its dollar peg. The depegging of USTC caused widespread panic in the cryptocurrency markets, as the stablecoin had risen to become the third-largest stablecoin in existence before collapsing. The collapse of Terra had a domino effect on the rest of the cryptocurrency market due to massive liquidations and uncertainty, which fueled a cryptocurrency lending crisis. Due to their inability to maintain liquidity in the face of harsh market conditions, a number of global crypto lenders, including Celsius, have had to suspend withdrawals.
For more than three years, Bitcoin’s price has been trading below previous highs. The previous peak of $68,000 occurred only seven months ago, and it remains to be seen whether and when Bitcoin will reach new highs.
Related
- TerraUSD’s Dollar Depeg Halts Distribution of Remaining the Assets
- According to Dappradar’s report, crypto is not suffering much from the bear market
- NFTs Explored — What are NFTs? How to Buy NFTs & What’s the Best NFT to Buy Now in 2022?
Join Our Telegram channel to stay up to date on breaking news coverage