

Swing trading, one of the most popular investing strategies in crypto, is often the perfect middle ground between the rapid world of day trading and the long-haul strategy of HODLing. As a swing trader, you would be riding meaningful price movements, which can last days or weeks, without having to remain glued to charts all day.
The crypto world is highly volatile, which means that these swings can often be massively profitable but also risky. That being said, this guide will explain how swing trading works and who it is best for.
What Is Swing Trading in Crypto?
Swing trading is a strategy where traders hold crypto positions anywhere from a few days to several weeks, intending to profit from short-to-medium-term price fluctuations.
This trading strategy relies heavily on technical analysis, using tools like moving averages, RSI, MACD, Fibonacci retracements, support and resistance levels, and other chart patterns. The point of all of this analysis is to spot potential entry and exit points.
The goal of swing trading isn’t to capture every tiny move, even though it might sound that way. Instead, the idea is to “ride” a leg of a larger trend. You might go long on a rising bounce or short on a dip, hoping for solid gains without having to make lightning-fast trades.
Since crypto trades 24/7, swing traders must stay alert to technical signals and events over several days. This tactic is more strategic compared to day trading, but a lot more active compared to long-term investing.
Crypto Day Trading Vs. Swing Trading
There are countless different ways to trade crypto. Day trading and swing trading are both active trading styles. Still, they differ in pace, goals, and time investments.
Day trading is all about speed. Traders buy and sell crypto within the same day, often within minutes. Their goal is to profit from small price movements, which is why they often make multiple trades in a single session. Day traders avoid holding positions overnight because of the risks of surprise news and price gaps.
Swing trading is slower and more strategic. Instead of chasing short bursts, swing traders aim to catch bigger price swings over days or even weeks. They analyze trends, wait for setups, and let trades “breathe.” It is less intense but still quite active.
| Feature | Day Trading | Swing Trading |
| Trade Duration | Minutes to hours | Days to weeks |
| Time Commitment | Full-time, needs constant monitoring | Part-time, check charts occasionally |
| Number of Trades | Many trades per day | Few trades per week |
| Goal | Small and fast profits | Larger gains over medium-term trends |
| Tools Used | Technical analysis, Level 2 data | Technical and fundamental analysis |
| Risk Exposure | Low overnight risk (positions closed daily) | Exposure to overnight/weekend swings |
| Stress Level | High (fast decision-making needed) | Moderate (more planning, less rush) |
| Best For | Full-time traders with experience and fast reflexes | Part-time traders with patience |
How Swing Trading Works
Successful swing trading is all about timing your trades to catch price swings (up or down) that happen over a few days or weeks. The goal isn’t to chase every tiny move. Instead, you can wait for a clear setup, enter at the right time, and exit when the trend starts to slow down or reverse.
Swing traders look for the following:
- Trends: Is the price moving up, down, or sideways?
- Support and resistance levels: Where do prices tend to bounce or reverse direction?
- Chart patterns: Flags, triangles, and double bottoms/tops often signal a coming move.
- Momentum indicators: Tools like RSI and MACD can help traders judge if the current move still has strength.
Holding Periods
Most swing trades last a few days, and a more limited number of them stretch to a couple of weeks. If you decide to do crypto swing trading, you don’t need to sit at your screen all day, but you do need to check in regularly to manage risk or take profits if your target is hit because of the market’s immense volatility.
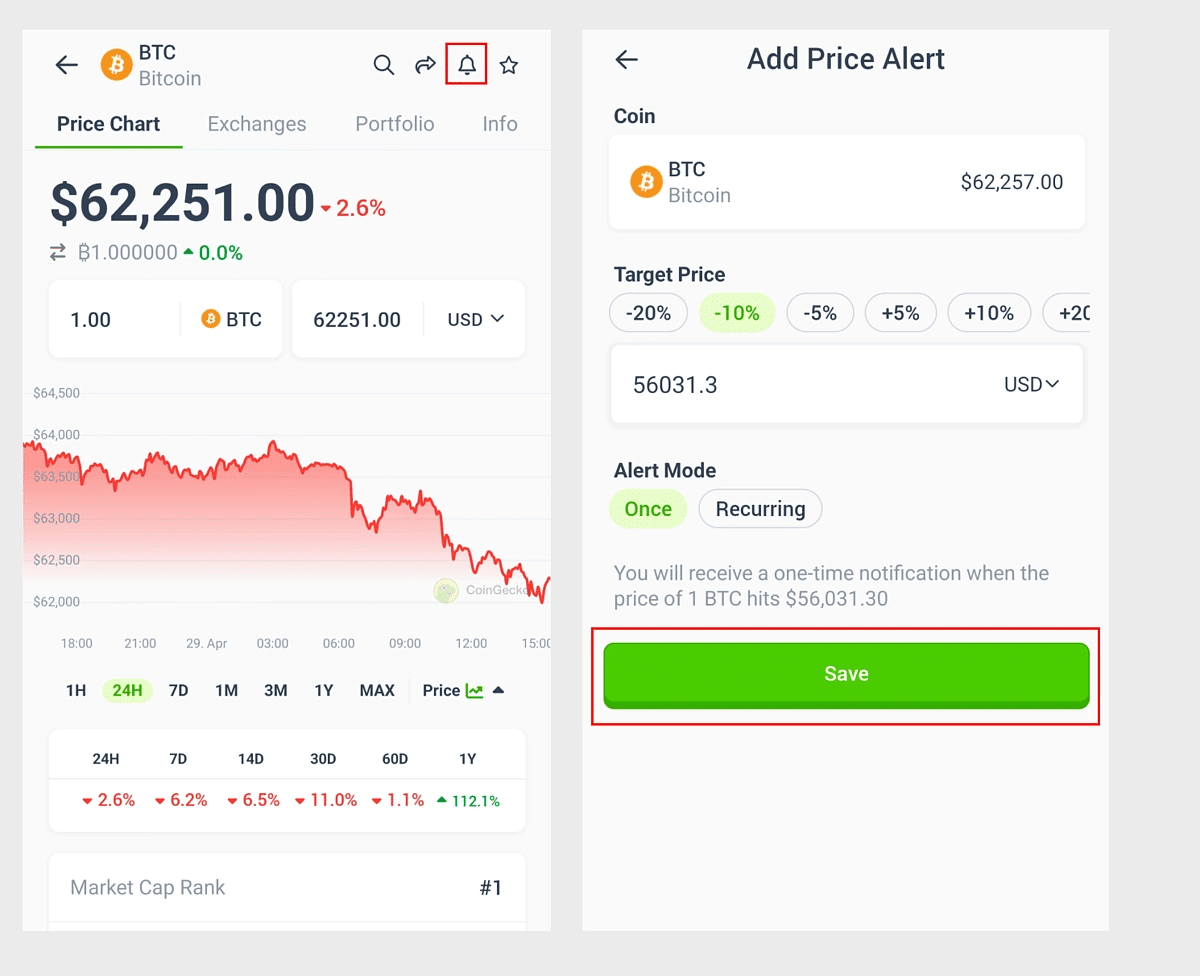
Swing traders use limit orders and stop-losses to automate exits, especially since crypto trades nonstop. They often use tools like TradingView, CoinMarketCap, and CoinGecko charts to set alerts and track price zones.
Here is what this looks like on CoinGecko:
Volatility Equals Opportunity (and Risk)
The crypto market is one of the most volatile markets in the world, far more volatile than stocks.
According to ARK Invest’s “Big Ideas 2025” report, Bitcoin’s volatility has dropped to historic lows. Its one-year rolling volatility is now consistently below 50%. Yet, volatility remains significantly higher than traditional assets. Despite this decline in volatility, BTC is roughly 4.6 times more volatile than global equities and about 3.9 times more volatile than gold.
Even the largest altcoins, like Ethereum, Solana, and Avalanche, are much more volatile than BTC and most other asset classes. In early 2025, Ethereum showed a 30-day realized volatility above 60%, while smaller altcoins like Solana often spike beyond 80% during market swings.
This is why swing traders love it – it creates more, larger swings to trade.
However, the volatility also means that moves can be sharp and sudden, which is why, if you decide to swing trade, you need to plan your exit as carefully as your entry. Prices can reverse fast on news, hacks, and even minor macro shifts. So, if you are swing trading, you can consider using stop-losses and profit targets as your safety net. Most successful swing traders don’t see them as optional at all.
Technical and Fundamental Analysis
Swing trading relies heavily on technical analysis. That means looking at price charts, patterns, and indicators like RSI (Relative Strength Index), MACD (Moving Average Convergence Divergence), and moving averages to spot potential trade entries and exits.
However, while this method of crypto trading mostly leans on technical analysis, it also relies on fundamental analysis.
Technical analysis can help you decide when to trade, while Fundamental analysis can help you decide what to trade.
For instance, if a coin is showing a bullish pattern (technical), and there is positive news like a new partnership or exchange listing (fundamental), it could be a good opportunity to trade.
Expert tip: Pros usually use fundamentals to pick high-potential coins, then use technicals to time their entry and exit.
Top Swing Trading Strategies in Crypto
Swing trading is a popular way to trade crypto and can potentially be highly profitable. However, while the crypto market’s volatility creates plenty of opportunities for swing traders, it also creates great risks. This is why choosing the best swing trading strategy is crucial for your success. Let’s take a look at the top swing trading strategies.
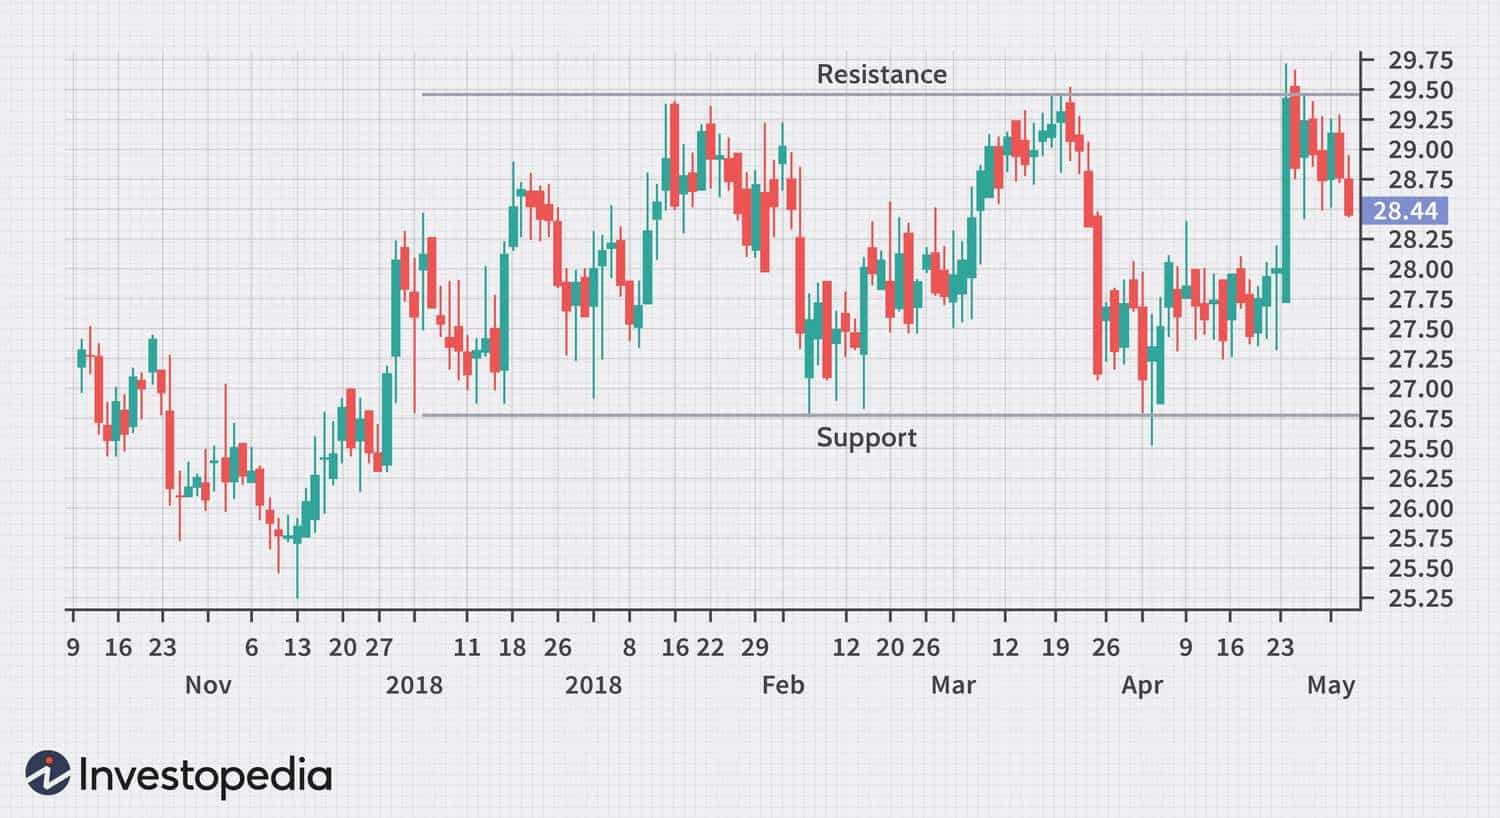
1. Range Trading
This trading strategy is often best when a crypto is trading sideways. When the crypto is stuck between clear support and resistance levels, it is similar to the price bouncing inside a box. This is why range trading is often referred to as “stuck in a box.”
How Pros Use It:
- Identify horizontal support and resistance lines on the chart
- Buy near the bottom of the range (support)
- Sell near the top of the range (resistance)
- Stop losses just outside the range
Why It Works:
Cryptocurrencies often trade sideways before a breakout. Swing traders take advantage of the little up-and-down moves while they are waiting for the next big trend. However, major drops or spikes can occur in milliseconds, which is why stop-loss orders are so useful in swing trading.
Example: If Bitcoin is trading between $28,000 (support) and $30,000 (resistance), you can buy near $28,000 and sell near $30,000 until the price breaks out.
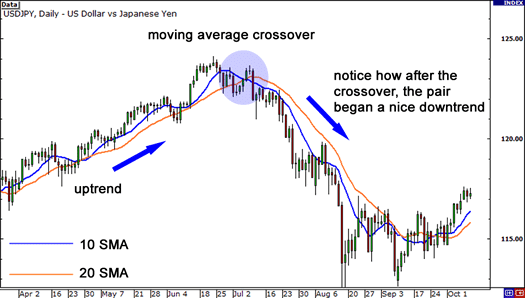
2. Moving Average Crossovers
This strategy uses two moving averages (MAs) of different lengths (a short-term MA and a long-term MA) to spot when a trend might be changing. It’s kind of like watching two lines race. When the faster one crosses the slower one, it signals a possible new direction.
How Pros Use It:
- Use two moving averages: one short (like 10-day) and one long (like 50-day).
- When the short MA crosses above the long MA, that’s a buy signal (a bullish crossover).
- When the short MA crosses below the long MA, that’s a sell signal (a bearish crossover).
- Place stop-losses near the most recent swing, high or low, depending on the trade direction.
Why It Works:
Moving averages smooth out the chart, making trends easier to spot. Crossovers can help traders get in early before the price moves too far in one direction.
Example:
If Ethereum’s 10-day average moves above its 50-day average, this might mean the price is starting an uptrend.
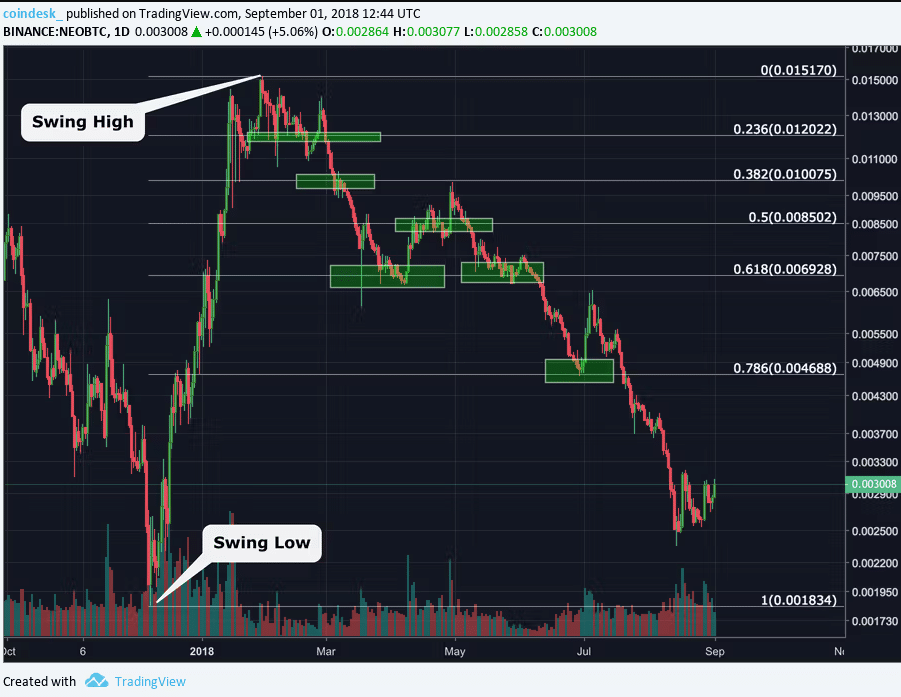
3. Fibonacci Retracement
Fibonacci retracement or Fibonacci pullback helps traders figure out where the price might take a break before it continues its trend. Traders use a special tool based on math (the Fibonacci sequence) to mark possible “rest stops” in a trend.
How Pros Use It:
- Identify a recent significant price move (up or down).
- Use the Fibonacci tool on a charting app like TradingView. It will draw lines at levels like 38%, 50%, and 61% (the potential bounce zones).
- If the price pulls back to one of these and starts turning again, it could be a chance to jump in.
- Set stop losses slightly beyond the next Fibonacci level to protect against sudden crashes.
Why It Works:
The tool is built into most trading platforms, and once you learn how to draw it, it makes it easy to know when to wait and when to act.
Example: If Bitcoin jumps from $20,000 to $30,000, it might pull back to the 38.2% retracement near $26,180 before it continues moving upward. This could signal a great buying opportunity.
4. MACD (Moving Average Convergence Divergence) Strategy
MACD is a fancy name for a tool that shows when momentum is changing. It stands for moving average convergence/divergence, and it’s similar to using moving average crossovers.
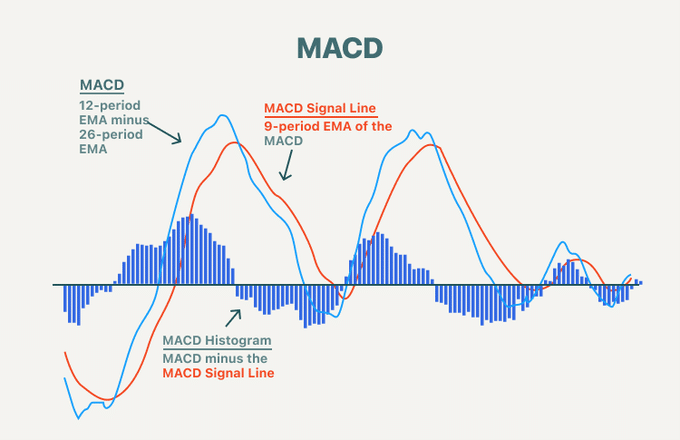
How Pros Use It:
- Look at the MACD line (difference between 12-day and 26-day EMAs) and the Signal line (9-day EMA of MACD). Most trading apps have it.
- Buy signal when the MACD line crosses above the Signal line (bullish crossover).
- Sell signal when the MACD line crosses below the Signal line (bearish crossover).
- Use histogram bars for additional confirmation of momentum strength.
- Place stop losses near recent swing lows or highs.
Why It Works:
MACD helps spot shifts in momentum before price changes become obvious, allowing traders to catch early swing moves.
Example:
When Ethereum’s MACD line crosses above its Signal line after a downtrend, it could signal a good time to enter a long swing trade.
5. Volume Analysis
Volume is the number of coins traded in a given time and is a powerful indicator of market trend strength or reversals.
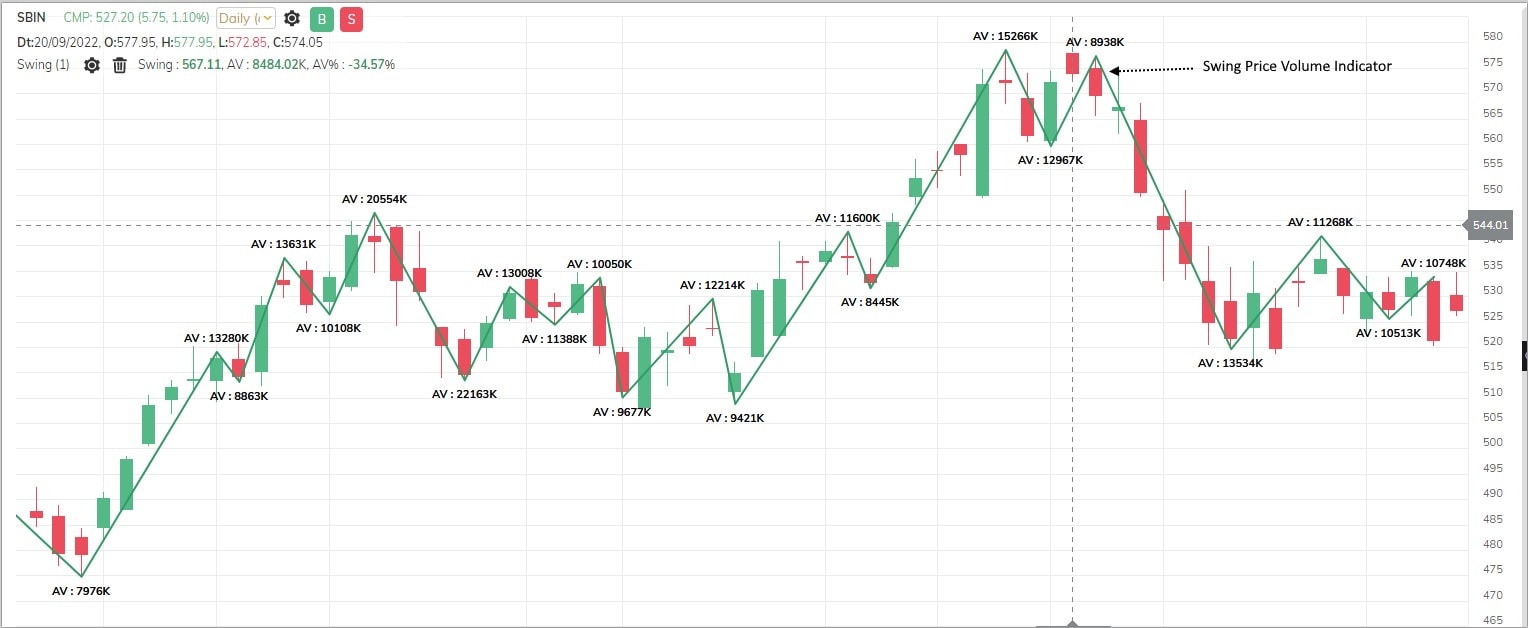
How Pros Use It:
- Look for increasing volume confirming price moves (up or down).
- If the price goes up with high volume, it could be a bullish signal
- If the price breaks a level on low volume, it might be a trap (fakeout).
- Combine volume with breakout or RSI strategies for more confirmation.
- Avoid trading during dead volume (when no one is doing much).
Why It Works:
Volume shows real market participation and conviction behind moves. High volume during swings is a sign of stronger, more reliable price action.
6. Relative Strength Index (RSI) Reversal Strategy
RSI or relative strength index is like a mood meter. It tells you when a crypto is too hyped up (overbought) or too beaten down (oversold), and might be ready to swing the other way.
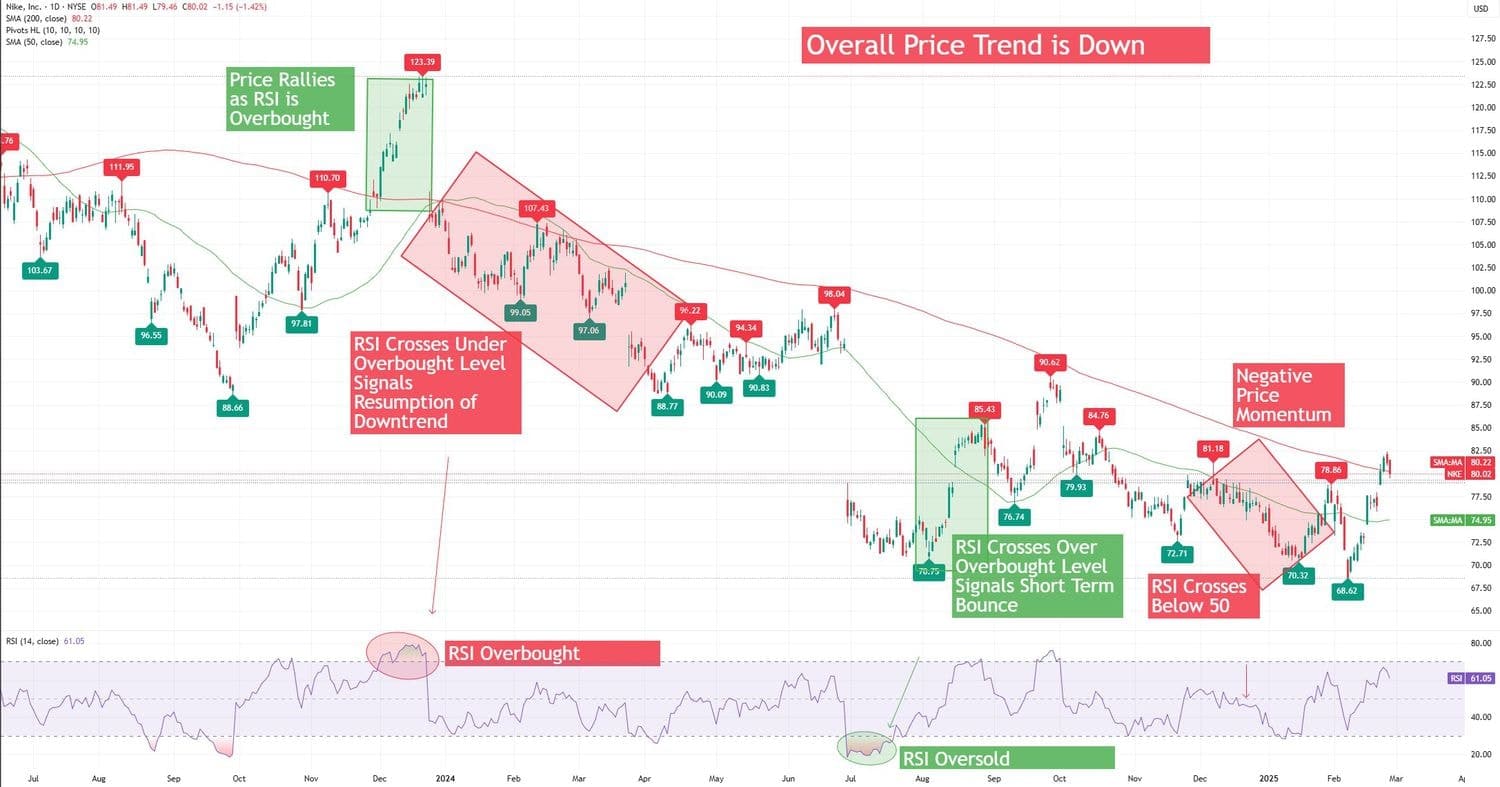
How Pros Use It:
- Use RSI on a 14-day period.
- Buy signal when RSI drops below 30 (oversold) and then crosses back above 30 (potential trend reversal).
- Sell signal when RSI rises above 70 (overbought) and then crosses back below 70 (potential trend reversal down).
- Rarely act on RSI alone and often wait until the price also starts to turn.
- Add a stop-loss just in case the price keeps going.
Why It Works:
RSI helps spot when a crypto might be temporarily overextended and due for a swing reversal, signaling strong entry points.
Example:
If Ethereum’s RSI dips to 25 and then climbs back above 30 near a support zone, it could be a good buy signal for a swing trade.
| Strategy | What It Means | When to Consider It | Tools Needed |
| Range Trading | Trading between a set high (resistance) and low (support) | When price moves sideways without a clear trend | Charting platform with drawing tools |
| Moving Average Crossovers | Uses two MAs to signal trend changes | When looking for trend reversals or confirmation of trend direction | Moving Averages (MA) indicator |
| Fibonacci Retracement | Identifies likely pullback levels using Fibonacci ratios | After a strong uptrend or downtrend, during price correction | Fibonacci tool |
| MACD Crossovers | Tracks momentum shifts using MACD and Signal lines | When momentum looks like it’s fading or building | MACD indicator |
| Volume Analysis | Analyzes trade volume to confirm the strength of price moves | When the price breaks out of support/resistance or a trend line | Volume indicator |
| RSI Reversal Strategy | Uses the Relative Strength Index to find overbought or oversold zones | When the price feels too high or too low and might reverse | RSI indicator |
Risk Management for Swing Traders
Even with the best strategy, one bad move (or just bad luck) without proper risk control can wreck your account. That being said, let’s take a look at some risk management tips swing traders use these days:
- Never trade more than you can lose. Experts suggest that traders should risk only 1-2% of their portfolio per trade.
- Always consider stop-losses. The stop-loss order is one of the most important tools in swing trading.
- Don’t overtrade. It can be tempting to be in the market at all times, but fewer high-quality trades are often better than many random ones with little technical confirmation.
Pros and Cons of Swing Trading in Crypto
Like all trading styles, swing trading comes with its own set of strengths and weaknesses. Let’s see what you’d be signing up for if you decided to start swing trading:
| Pros | Cons |
| Doesn’t require watching charts all day | Still needs regular monitoring |
| Offers more trades than HODLing and less stress than day trading | Overnight moves can wreck your setup |
| Allows time to plan and analyze every trade | Emotional swings can still get in your way |
| Technical patterns are easier to spot than in lower timeframes | This is a strategy with a steep learning curve and major risks, used by experienced traders |
Who Is Swing Trading Best For?
Swing trading isn’t for everyone. You might want to consider it if you:
- Have some free time each week to check charts and manage your trades
- Prefer strategy over speed and don’t want to be glued to the screen all day
- Are an experienced trader or enjoy technical analysis and learning patterns
- Can handle uncertainty and at least a few losses here and there (not every trade will go your way)
- Want more action than long-term investing but less chaos than day trading
On the other hand, swing trading is not ideal if you are an impatient person who expects instant results or if you panic when the prices change a little. Also, if you are a beginner and don’t want to spend time learning charts and tools, this might not be the right crypto trading strategy for you.
How to Start Swing Trading
Starting anything new can feel overwhelming, especially when it is as complicated as swing trading. To help you, below is a simple roadmap you can use to help get you started:
Step 1: Learn the Basics
Swing trading is not simple, so you must first understand how it works, what trends look like, and how indicators like RSI and MACD behave. This post is an excellent start, but you might also want to check out YouTube videos and other educational resources before you start investing.
Step 2: Pick a Good Exchange
The first step to take if you decide to take on crypto swing trading is to choose a good exchange. Binance, Kraken, and Coinbase are some of the best on the market and have all the charts and tools you will need.
Step 3: Use TradingView for Charting
TradingView is a free tool where you can draw trendlines, apply indicators, and practice your analysis before you start placing any real trades. Good charting and analysis tools are essential for successful swing trading, and TradingView is the clear leader in both.
Step 4: Start Small
You don’t need real money right away. You might want to try paper trading first to practice your trading strategy without risk. If you’re consistently making profitable trades, it might be time to start small with real money next.
Step 5: Focus on 1-3 Coins
It will likely be easier and less risky to stick to high-volume, well-known coins like Bitcoin, Ethereum, or Solana. They are less likely to make unpredictable moves compared to small-cap coins, and you can start learning their patterns more easily.
Step 6: Log Everything
Keep a simple journal of every trade, noting down what you bought, why you entered, your trading objectives, and how the trade went. Every mistake is a lesson if you write it down.
Common Swing Trading Mistakes to Avoid
New traders often fall into the same traps. Here is what you should watch out for:
- No stop-loss
Stop-loss orders form the foundation of swing trading risk management. Crypto is volatile, and if you don’t protect yourself, one wrong move can wipe you out.
- Chasing green candles
Just because a coin is pumping doesn’t mean it is a good time to buy. Often, you are the last one in.
- Trading too many coins
It’s usually smart to stick to a limited number of coins at first. Jumping between 10 coins can leave you confused and exhausted.
- Ignoring market conditions
Don’t trade long in a downtrend just because one indicator flashed green or some influencer suggested it. Always do market analysis and check the bigger picture.
- Getting emotional
FOMO and panic are the top two account killers. To avoid this, create a plan before the trade with proper risk management and stick to it.
Conclusion
Swing trading in crypto can be exciting and potentially very rewarding. Still, it is a risky strategy reserved for more experienced investors. It’s not about catching every price move. It’s about finding high-probability setups and managing your risk, as well as acting on a plan, not emotions.
You don’t need to stare at charts 24/7 or try to be perfect. With the right trading strategy, you can spot real opportunities in the chaotic crypto market. Start small, learn from each trade, and treat every mistake as a lesson. The goal isn’t just to make money. It is to become a smart, disciplined trader so that you can succeed in the long term.
FAQs
What is the difference between day trading and swing trading?
Cryptocurrency offers different trading methods today. Day trading means entering and exiting trades within the same day. Swing trading holds positions for several days or weeks.
Do I need to be an expert to swing trade?
No, but you do need to have knowledge of the fundamentals, be good at reading charts, and know how to manage risks. You can start small and build your skills over time.
How much money do I need to start swing trading?
You can start with as little as $50-$100, depending on the exchange you choose. Still, you should remember to only use money you can afford to lose, and start with small amounts while learning.
Can I swing trade with just my phone?
Yes. Many exchanges like Binance, Coinbase, and KuCoin come with mobile apps. However, for charting and analysis, it is easier to use a desktop platform.
How do I find good coins to swing trade?
Stick to high-volume, well-known coins at first, like Bitcoin, Ethereum, and Solana. Watch for coins in the news, with big upgrades or strong trends.
Is swing trading profitable?
It can be, but it takes time to get consistent. Profitable traders follow a strategy and know how to manage risks. There are no guarantees, but there surely is a process.
References
- How to Set Up the Price Alert Function on CoinGecko – CoinGecko
- Lower Volatility, High Returns: ARK Invest’s Ideas 2025 Report – CoinEdition
- Bitcoin Volatility Trends – iShares
- Ethereum Volatility Index – TradingView
- Messari Predicts an Explosive Rise for Solana – CoinGape
- Trading Range: Definition, How It Occurs, How to Use – Investopedia
- How to Use Moving Average Crossovers – BabyPips
- MACD Trading Guide – Neha Singhal Trader on X
- Swing Price Volume Indicator – Definedgesecurities
- RSI Indicator: Buy and Sell Signals – Investopedia