

RSI or Relative Strength Index a popular indicator with traders in many different markets and industries that measures the momentum of price changes. RSI is particularly popular with crypto traders who try to determine when a coin is overbought or oversold.
This article explores the definition of RSI, its formula and calculations, and how it is used in cryptocurrency trading.
Understanding RSI in Crypto
RSI is a momentum indicator used in technical analysis. Crypto traders use the RSI indicator in decision-making to identify patterns and trends in asset prices. Traders can take an asset’s RSI into account to help make informed decisions on when to enter or exit the market.
Traders often evaluate a market’s buying and selling signals through technical analysis. A buying signal indicates the possibility of a future price increase. On the other hand, selling signals indicate a possible price decrease, meaning it might be best to sell the assets before the price decreases or wait until the next price increase. Naturally, these signals are wrong all of the time and we will explore the risks of overzealously relying on indicators later on in the article.
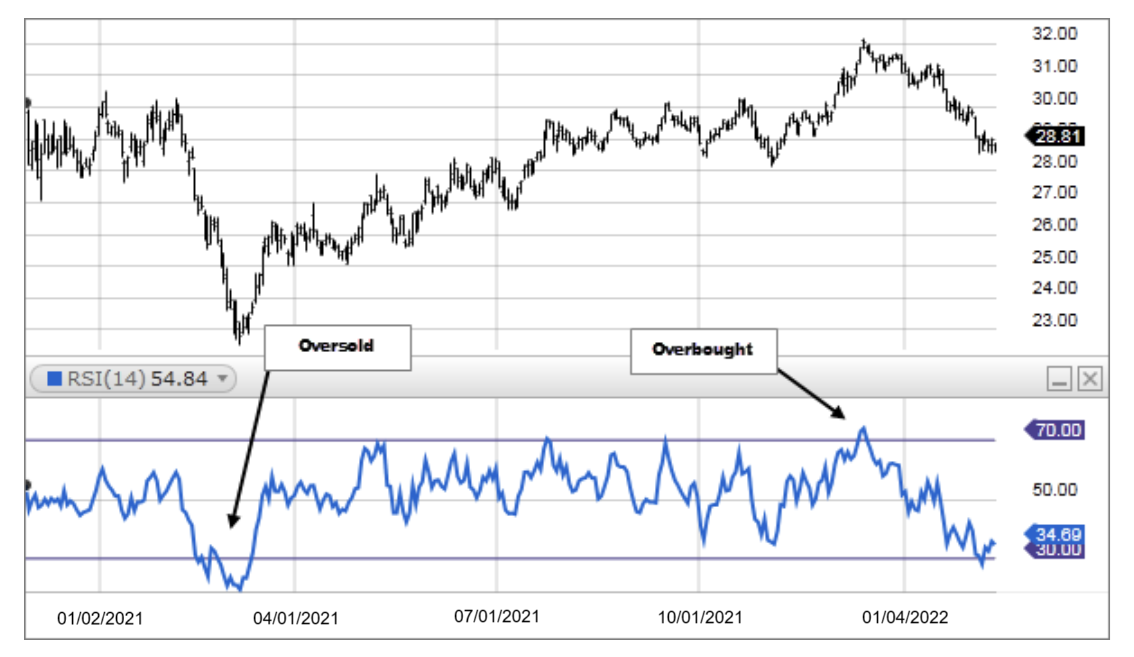
Typically, an asset’s RSI ranges from 0 to 100, where market conditions are marked as oversold when the RSI is below 30 and overbought when the RSI is above 70.
An oversold condition indicates heavy selling pressure, often following a recent price drop. An overbought condition reflects strong buying pressure, usually after a price rally. Some traders use these conditions to predict a reversal in price. For example, a crypto may shoot up after major selling pressure is depleted. However, this is not always the case. There is no guarantee of a reversal, and prices can continue to rise or fall even when a coin’s RSI is considered deeply overbought or oversold.
RSI, or Relative Strength Index, is widely used among crypto traders to identify buying-selling signals and oversold-overbought trends. However, it works best in combination with other indicators, and traders should be wary of its usefulness.
Often, traders use the RSI indicator with Moving Average Convergence Divergence (MACD), moving averages, and the average directional index (ADX) to improve their technical analysis, hoping to piece together a strong picture of the coin’s price movement.
How to Calculate RSI with a Formula
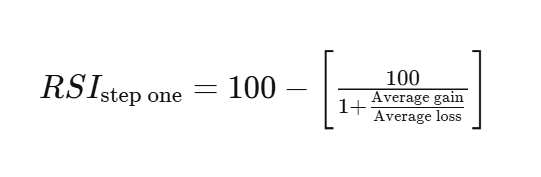
The general formula of RSI calculation is as follows:
RSI = 100 – (100 / (1 + RS))
Here, RS refers to relative strength, which is calculated by dividing the average gain by the average loss. So, calculating the RSI using this formula involves determining the average gain and average loss.
RS = Average Gain / Average Loss
The formula can be elaborated as below:
Calculating the average gain and loss
A specified period must be selected to determine the average gain and average loss. Typically, traders use 14 days to calculate the averages, though some use other intervals. The initial average gain and loss are simple averages over the first 14 periods, but subsequent averages use Wilder’s smoothing method.
Let’s say from day 1 to day 14 there are +1%, +5%, +3%, +2%, +1%, +2%, +1% gains and -1%, -1%, -2%, -2%, -1%, -1%,-1% losses.
So for a 14-day period, the average gain is: (Sum of all gains during these 14 days) / 14
So, Average gain = (1+5+3+2+1+2+1) / 14 = 1.07%
For a 14-day period, the average loss: (Sum of all losses during these 14 days) / 14
Therefore, Average loss = (1+1+2+2+1+1+1) / 14 = 0.64%
Calculating RS
Let’s use the average gain and loss values to calculate the value of RS:
RS = Average Gain / Average Loss = 1.07 / 0.64 = 1.67
Calculating RSI
Including all the values in the RSI formula,
RSI = 100 – (100 / (1 + RS)) = 100 – (100 / (1 + 1.67)) = 62.55
So, the stock’s RSI value is 62.55 over the 14-day timeframe. The range is normal – no overbought or oversold conditions are present.
Note: The RSI formula is calculated with the absolute values of gains and losses (treating all changes as positive numbers), and periods with no gain or loss count as zero.
How to Use RSI in Crypto Trading
RSI indicates overbought and oversold conditions, but during strong trends, it may stay overbought or oversold for long periods. Acting too quickly on these signals without considering the broader trend and other important factors can be a mistake.
Traders often use the RSI indicator to discover whether values are near support and resistance levels. Here, support acts like a price floor, where downward movement often reverses or slows as buying pressure takes over. Resistance, on the other hand, acts like a price ceiling, where upward price movement often stalls due to increased selling pressure.
Here are the three main ways to use RSI to identify market trends.
1. Overbought and Oversold Conditions
An overbought condition suggests a potential price drop, prompting traders to sell high and buy back lower. An oversold condition indicates a possible rebound, signaling a buying opportunity.
These RSI signals benefit traders in sideways markets, where prices move between support and resistance levels. They can assume when the prices may change depending on the RSI value near support or resistance levels.
However, these RSI indicator signals alone are insufficient for trending markets where prices are clearly moving in a particular direction. For best results, traders must use RSI with other indicators to evaluate market trends.
2. Bullish and Bearish RSI Divergences
Traders can spot divergences when price and RSI values move in opposite directions.
Let’s say the cost of crypto increases, but the RSI value is decreasing, signaling a trend reversal. Divergence signals alert traders to potential changes in trends. Two types of RSI divergences are mostly seen:
- Bullish Divergence occurs when the price drops while the RSI is increasing, signaling that the trend will reverse and the price will rise. This is typically seen as a buying sign for traders.
- Bearish Divergence occurs when the price rises consistently while RSI starts to drop, signaling a reverse trend, where one might see a price-decreasing trend soon. This is usually a selling signal.
3. Swing Rejections
Traders use swing rejections to track trend reversals more reliably. Swing rejections can be of two types:
Bullish Swing Rejections occur when the RSI dips into oversold territory, rebounds, forms a higher low, and then breaks above its previous high – signaling a potential upward trend.
Bearish Swing Rejections happen when the RSI climbs into overbought territory, retreats, forms a lower high and then falls below its previous low – indicating a possible downtrend.
This strategy includes four steps:
- The RSI indicator shows overbought (above 70) or oversold (below 30) conditions
- RSI then moves back toward the middle range (between 30-70)
- RSI moves again but stays in the middle range, not reaching extreme levels
- RSI breaks through its recent high or low point, confirming the trend change
Now, given all that, how do you interpret the RSI?
For RSI interpretation, 70 and 30 are the default overbought and oversold thresholds. For example, once a specific crypto’s RSI surpasses 70, it crosses the overbought threshold, indicating a potential reversal.
Moreover, if the RSI of a crypto increases above 50, it signals bullish momentum. On the other hand, falling below 50 signals Bearish momentum.
In trending markets, RSI is interpreted in many different ways. In fact, many traders don’t even wait until the RSI hits 30 or 70 to make trades and instead focus on its direction and rate of change, fearing that they will miss their chance by waiting too long.
Watch Out for These RSI Mistakes
RSI is a valuable trading indicator, but it’s far from 100% accurate. Putting too much trust in RSI or any single indicator can lead to poor decision-making.
Here are a few common RSI mistakes every trader should avoid:
- Using only RSI as a sole trading indicator is a common mistake. Traders should consider other indicators as well as other factors like fundamentals and market conditions alongside.
- Overconfidently using RSI when an asset is in a strong trend is another common misstep. The RSI can remain overbought or oversold for longer than you might expect. Misinterpreting RSI can lead to a premature exit or a missed opportunity.
Other Popular Crypto Trading Indicators
Here are 4 of the most popular crypto trading indicators.
Moving Average Convergence Divergence (MACD)
The Moving Average Convergence Divergence is a trading indicator that identifies buying and selling signals. While MACD is a trusted indicator, it’s also not 100% accurate. MACD can sometimes give misleading signals, especially in sideways or range-bound markets. Often, MACD is used with RSI and other indicators to help make more informed trading decisions.
Accelerator Oscillator (AC)
Accelerator Oscillator (AC) is a trading indicator used to identify changes in the market momentum and the direction of that change. Traders use it to look for early warnings of trend reversals and trend strength to avoid bad entries. However, AC may also produce false signals, especially in sideways markets. Many advanced traders like to use RSI, MACD, AC, and other indicators to gain a better understanding of the market’s movements.
Bollinger Bands
Bollinger Bands are another popular trading indicator used in technical analysis to measure asset volatility and identify overbought and oversold signals. Traders often use this indicator with other indicators to determine potential entry and exit points. While Bollinger Bands indicate potential price levels and trend strength, they do not clearly show the direction of price movements.
Moving Averages (MAs)
Traders use Moving Averages (MAs) indicators in technical analysis to smooth out fluctuating prices and generate an average. MAs help determine potential trend direction, entry and exit signals, and trend strength.
Like the other indicators above, MAs can be misleading. For instance, using multiple MAs or using MAs in sideways markets can lead to false or unreliable signals. Moving averages also simply don’t provide a comprehensive view of the market by themselves. That’s why traders use it in conjunction with many other indicators.
Is RSI Worth Using in Crypto Trading?
The Relative Strength Index (RSI) measures the speed of price changes and the potential magnitude of each change, making it a helpful tool for decision-making in crypto trading. However, it’s incredibly important to understand that RSI, like every other technical indicator, is far from perfect.
While many traders find it valuable to help identify the momentum of price changes, most successful traders combine RSI with many other indicators before they make trades. RSI can be a valuable indicator in a diversified trading toolkit, but it’s rarely ever useful as a standalone metric.
FAQs
What RSI level is good for buying?
Generally, an RSI below 30 is considered a strong buy signal. However, it's important to consider several trading indicators before buying, as RSI alone is rarely a reliable predictor of price movements.
Which indicator is best for crypto trading?
Bollinger Bands, RSI, moving averages, and MACD are some of the most popular crypto trading indicators. However, no single indicator is accurate all the time, and they can also be misleading if not interpreted properly.
Is a higher RSI better?
No, a higher RSI isn't always better. Its effectiveness depends on multiple factors, including the trader's entry or exit goals, RSI threshold, market momentum, and more.
Can RSI predict price?
No, the Relative Strength Index (RSI) can't accurately predict prices on its own.
Is Oversold good or bad?
Oversold isn’t inherently good or bad—it may signal a buying opportunity, but it can also indicate strong selling pressure. Context is crucial.
Which one is better for divergence? RSI or MACD?
RSI is often better for spotting overbought and oversold conditions in range-bound markets, while MACD is more effective for identifying trends and momentum in trending markets.