
The Crypto Fear and Greed Index is like a market mood ring for the crypto market. The idea is to gauge the confidence or fear of market participants to help gain an understanding of the current status of the market. It summarizes complex sentiment into a simple 0-100 score.
The Fear and Greed Index does not predict the future. Instead, it places a spotlight on when the market might be overreacting (either by selling off in fear or buying feverishly out of greed).
Why does this matter? Well, imagine crypto community forums lighting up with panic posts during a crypto crash. Or, imagine a wave of headlines talking about a “never-ending bull run.” These emotional extremes are exactly what the Fear and Greed index is designed to track, allowing traders to recognize the general mood of the market and avoid making bad, emotionally-driven decisions.
Let’s see what the Fear and Greed Index teaches us.
How Is the Fear and Greed Index Calculated?
There are multiple different Fear and Greed indices, including the Crypto Fear and Greed Index, which focuses entirely on the crypto market. It is built using a mix of metrics that reflect how investors are feeling or behaving on the market.
The Fear and Greed Index uses data such as volatility, trading volume, social media chatter, Bitcoin dominance, and even Google Trends data to calculate the market’s current sentiment.
The result of this data accumulation is a simple snapshot of the emotional extremes, ranging from “extreme fear” (0-24) up to “extreme greed” (75-100).
The most well-known version is published daily by Alternative.me. Here is what this looks like:
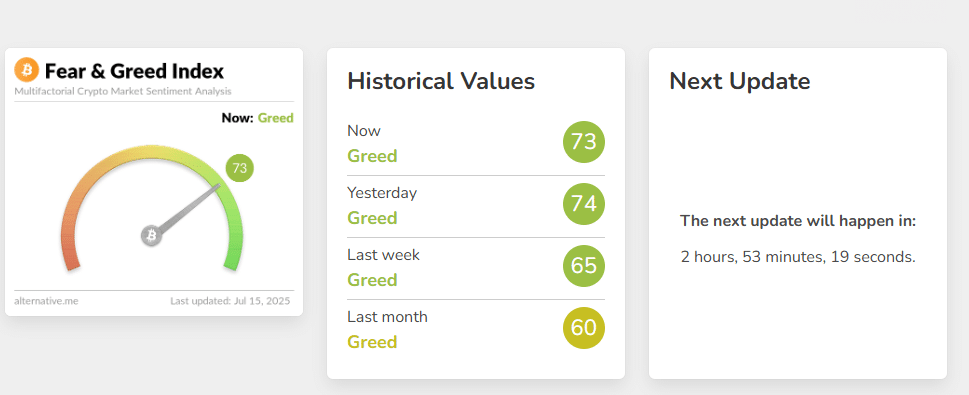
Here is how it breaks down on Alternative:
Volatility (25%)
This measures how much Bitcoin’s price swings compared to its recent averages over 30 and 90 days. When the volatility of the coin crashes suddenly, like a 10-20% drop in a short period, this is a sign of panic in the market, which pushes the index toward fear. On the other hand, a massive spike in the price over a short period is a sign of optimism in the market, pushing the index toward greed.
Example: In May 2021, Bitcoin’s price dropped sharply in only a few days, which caused its volatility to surge, and the index dipped into the “extreme fear” zone.
Market Momentum and Volume (25%)
This looks at the current trading volume and price momentum compared to recent history. When the volume grows alongside rising prices, it reflects growing greed, and more investors pile in. Conversely, falling volume or momentum could indicate fear.
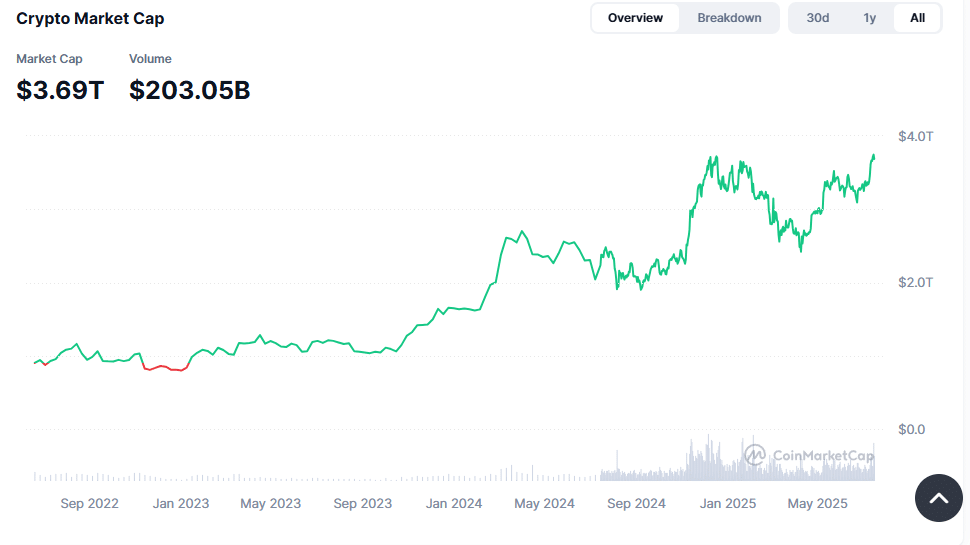
Example: In March 2024, Bitcoin’s rally past $73,000 was supported by huge trading volume worldwide and positive market momentum. This happened after a fortune was poured into the new Bitcoin ETFs. This pushed the index into the “greed” category.
Social Media Sentiment (15%)
This metric tracks how often and how positively or negatively Bitcoin and other crypto are discussed on social media platforms like X (Twitter) and Reddit. When there’s a flood of bullish posts and trending hashtags, this is a sign of increasing greed. When there is silence or bearish chatter, this indicates fear.
Example: When #BitcoinToTheMoon trended during the late 2020 bull run, social media activity pushed the index higher.
Bitcoin Dominance (10%)
This metric measures Bitcoin’s share of the entire crypto market capitalization. Rising Bitcoin dominance indicates that investors are retreating from altcoins into Bitcoin, which suggests fear or perhaps risk aversion.
A falling dominance, on the other hand, shows risk appetite and can indicate greed.
Example: After the 2022 market crash, Bitcoin dominance increased as altcoins lost more value. This signaled a flight to safety, where Bitcoin was once again considered a safe haven, so it pushed the index toward fear.
Google Trends (10%)
This metric tracks the market trends on Google and Bitcoin-related search queries. Basically, it will track market-related keywords and phrases like “buy Bitcoin” or “Bitcoin crash.” When there are many negative searches like “Bitcoin crash” or “sell Bitcoin,” this clearly signals growing fear. When there is a rising interest in buying crypto, this signals greed.
Example: During the Terra/Luna collapse in May 2022, “Bitcoin crash” searches grew dramatically, which coincided with the index dropping to 9, indicating extreme fear.
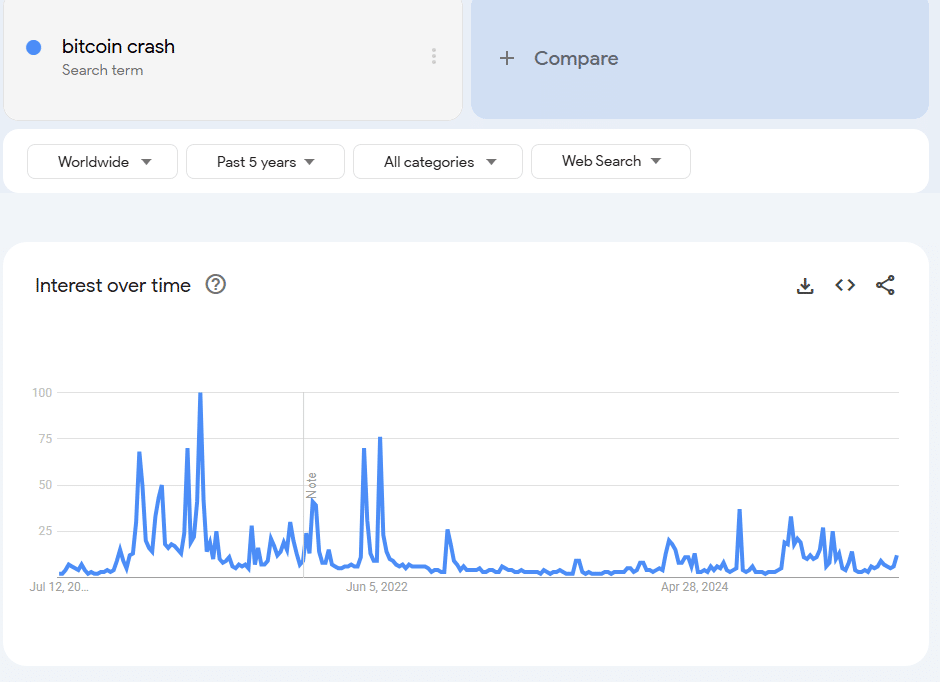
Source: Google Trends
Surveys (15%)
This is an optional metric, not used by all calculators. Some versions of the index poll investors on their sentiment directly, but this has become less common because of reliability concerns.
Why the Fear and Greed Index Matters in Crypto
The crypto markets move fast, often irrationally. The Fear and Greed Index can help traders cut through the noise. It offers a quick snapshot of what people on the market are feeling. In crypto, market sentiment and crowd behavior can drive price action more than most other factors, making this index a valuable analytical tool for traders.
When the index shows extreme fear, this usually means that there is a lot of panic and uncertainty among investors. This is maybe due to bad news, regulatory changes, or sharp corrections in crypto prices.
However, historically speaking, these moments can also present opportunities. For example, in November 2022, just after the FTX collapse, the index dropped to 20. Three months later, Bitcoin climbed back above $25,000.
On the other hand, extreme greed often accompanies hype cycles. In these cases, prices surge too fast, with retail investors piling in late. This is where most bubbles form. For instance, in April 2021, the index hovered around 80-90 for weeks before Bitcoin corrected from its then-high of nearly $65,000.
In other words, the index is helpful because it can give you a clue about whether the market is acting on emotion, and it might even signal when it’s a good idea to scale back.
How to Use the Fear and Greed Index
The Fear and Greed Index is no crystal ball. However, it can be a very helpful tool when you are making decisions on the crypto market, especially if you use it in conjunction with in-depth analysis and other useful tools and metrics. Here is how traders use the index to help them make difficult decisions:
- Play Devil’s Advocate: When others panic, consider whether there may be a strong opportunity coming soon. When they are greedy, ask yourself if you are late to the party; don’t rush to invest right away.
- Pair it with other analyses: It’s smart to avoid relying solely on the index (or really any single metric). Pull Google Trends data yourself, use it alongside RSI, fundamentals, geopolitical analysis, risk analysis, moving averages, on-chain data, and more, all to get a better picture.
- Risk management: In times of greed, traders often analyze whether it’s time to reduce exposure or set tighter stop-losses. In times of fear, pros research solid projects and prepare to accumulate coins with massive potential.
Real-World Tools and Resources
If you want to keep track of the fear and the greedy market behavior regularly, there are a few highly-trusted tools:
- Alternative.me – The most widely followed index, updated daily with a simple chart and historical data.
- CoinStats – This tool integrates the index into portfolio tools.
- LunarCrush – Tracks social sentiment in more detail and is very useful for understanding the mood behind the index.
- TradingView – Use it to overlay Fear and Greed data with price charts and find the correlations.
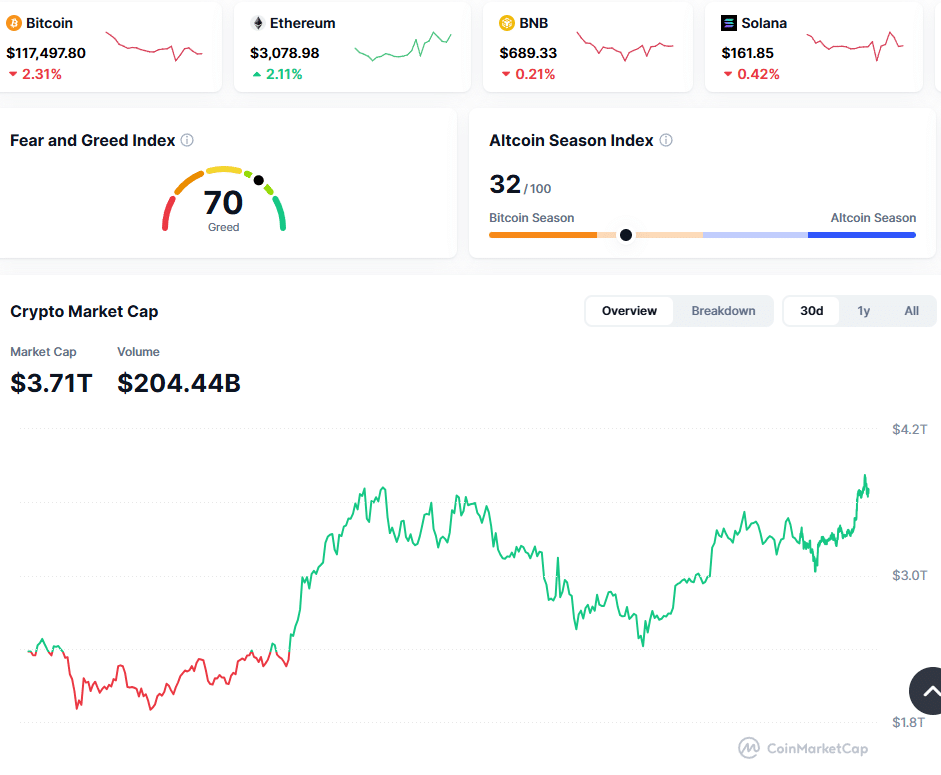
- CoinMarketCap – It will give you information about the Fear and Greed Index, Altcoin Season Index, market cap, and much more.
Limitations of the Fear and Greed Index
The Fear and Greed Index is useful, but it is not flawless. For starters, this is a reactive, not a predictive tool. It reflects on what is happening at the moment and cannot determine what will happen next.
Another big limitation of the index is Bitcoin-heavy bias. Most data points today are Bitcoin-focused, so the index might not reflect what’s happening in the altcoin space.
Next, there is the emotional noise and Bitcoin price manipulation. Sometimes, social and news spikes can distort the index, and manipulation can artificially lead to extreme greed or fear.
Finally, the index completely lacks nuance in such a complex market where nuance is essential. A single number simply cannot tell the whole story. A score of 80 could mean full-blown mania, but it can also mean sustained optimism (or it could be flat-out wrong).
Based on the market volatility and the simplicity of the index as a tool, it can be a good indicator or guide, but it’s far from a predictive tool.
Is the Fear and Greed Index Useful?
The Fear and Greed Index in crypto can be a very useful tool for tracking the crypto market behavior and getting a gut check on the market’s emotional state. It turns chaos into something you can easily understand and work with, especially in cases where there are extreme highs and lows. However, unlike any tools, the index works best when it is used along with other metrics and analytical methods.
If you find yourself panicking or are caught up in a hype, pause and check the index. It could give you some idea of whether the market is truly changing, or if you’re caught in the same emotional wave as everyone else.
Warren Buffett‘s famous line, “Be fearful when others are greedy, and greedy when others are fearful” encapsulates the spirit of the index. By keeping a close eye on market sentiment through the index and other tools, you can stay more grounded and make smarter, informed decisions.
FAQ
How often is the Crypto Fear and Greed Index updated?
The most popular versions of the index update once, sometimes twice a day.
Can the index predict crypto prices?
No. The index doesn't forecast exact price movements. Instead, it tells you how investors are feeling right now, potentially helping you to make better investment decisions yourself.
Which cryptocurrencies does the index focus on?
The index primarily focuses on Bitcoin because it has the largest influence on the crypto market sentiment. Other cryptocurrencies aren't directly measured.
Where can I check the Fear and Greed Index?
You can find the index on websites like Alternative, CoinStats, LunarCrush, and more.
How can crypto investors and traders use the index?
Traders use the index to identify a potential selling or buying opportunity. When the index shows extreme fear, it may signal a good time to buy at a lower price. When it shows extreme greed, it might be time to consider taking your profits or making a correction.
References
- Crypto Fear and Greed Index Published Daily – Alternative.me
- The May 2021 Cryptocurrency Crash Explained – Chainalysis
- Bitcoin’s Price History and Historical Data – Bankrate
- #BitcoinToTheMoon on BinanceSquare – Binance Square
- A Look at the Cryptocurrency Collapse of 2022 – Bressler
- Bitcoin Registers Biggest Single-Day Loss Since FTX’s Collapse – CoinDesk