

Join Our Telegram channel to stay up to date on breaking news coverage
Despite Bitcoin’s price surging past $30,000 per coin once again, the prevailing market sentiment remains skeptical, casting doubt on the resurgence of a bullish trend in the crypto sphere.
The monthly charts for Gold (XAU) and the US dollar via the Dollar Currency Index (DXY) hold the potential to offer early indications of an intriguing development on the horizon, awaiting confirmation.
Why Bitcoin Is Ready To Shine: It’s Not All Glitter
As we delve into the historical narrative, we find ourselves scrutinizing the enduring comparison between Gold and Bitcoin, tracing their trajectories within the intricate web of the financial realm.
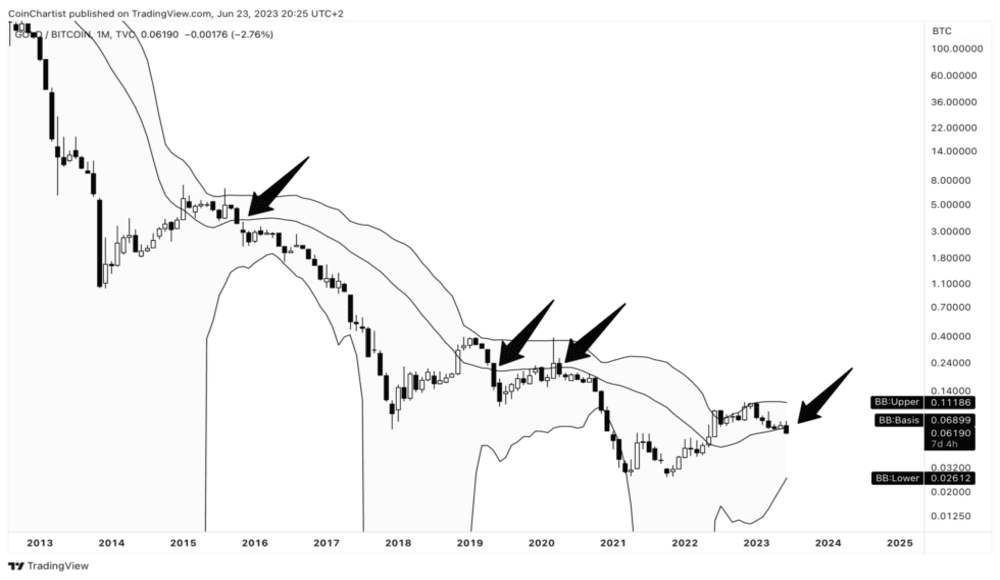
Upon analyzing the 1-month XAUBTC chart, it is evident that the June monthly candle extends beyond the Bollinger Bands baseline, indicating a potential bullish momentum for Gold priced in Bitcoin.
The Bollinger Bands, derived from a 20-period SMA and two standard deviations, dynamically adapt to market volatility, expanding and contracting to reflect changing conditions. These bands are a reliable indicator of price ranges and potential trading opportunities.
Historically, whenever XAUBTC closes below the basis, it has consistently led to price movements that reach the lower Bollinger Band. Considering the current levels, this pattern suggests the potential for a new all-time low on the chart, coinciding with a new all-time high for BTC priced in troy ounces of Gold. Such a scenario would significantly shift the relationship between these two assets.
BTCUSD Plunges Against the Dollar Index
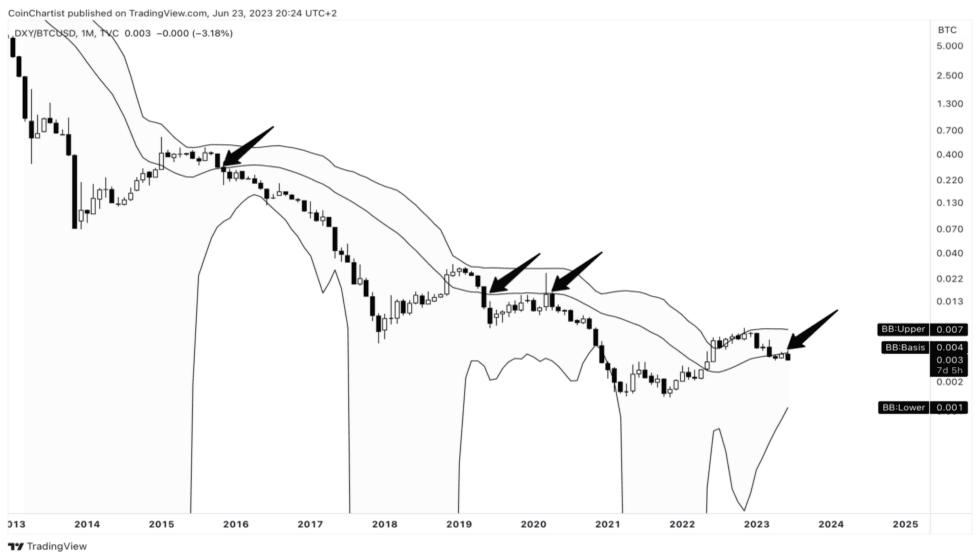
The chart juxtaposes the Dollar Currency Index (DXY) with BTCUSD, offering an alternative perspective on the crypto market’s correlation with significant macro assets. DXY comprises a collection of leading currencies traded against the US dollar, providing valuable insights into the dynamics between traditional currencies and Bitcoin.
The chart allows viewers to compare the performance of the US dollar with the performance of Bitcoin and observe the correlation between the two. This helps investors make more informed decisions about their investments and how they should position themselves in the current market.
The price surge extends its momentum beyond the “mid-BB,” mirroring the previous trend in the Gold chart, indicating potential bullish strength in the market.
Unlike the XAUBTC, where consolidation has been absent, the DXY/BTCUSD chart reveals a prolonged period of consolidation below the basis line, indicating confirmation of the basic line as a resistant level.
Historically, downward pressure on the lower Bollinger Band has been accompanied by new record lows on the infrequently employed ratio. Considering the DXY’s indication of dollar strength, this situation may potentially signal an imminent surge toward all-time highs on the standard BTCUSD chart.
The DXY’s strength makes it difficult for the BTCUSD ratio to break out of its current range and move into new territory. As the DXY strengthens, the downward pressure on the lower Bollinger Band may provide the necessary momentum to push the BTCUSD ratio to new all-time highs.
Join Our Telegram channel to stay up to date on breaking news coverage