Join Our Telegram channel to stay up to date on breaking news coverage

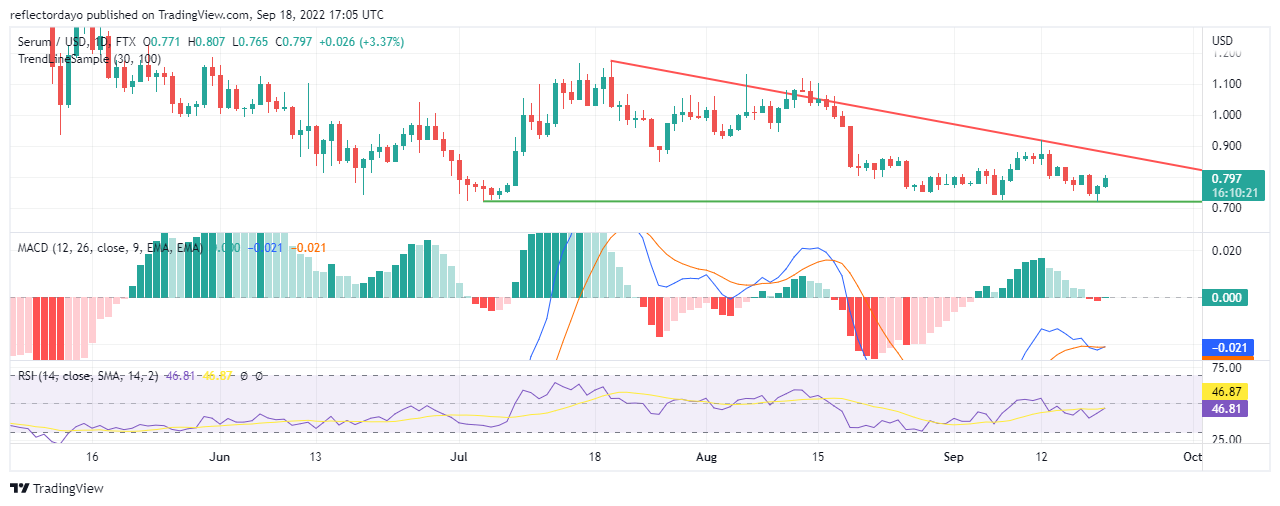
The price action of SRM/USD has maintained the same support level since the 4th of July. The price just keeps bouncing off the price level of $0.746. However, when we look at the resistance, we can see that the levels are falling (lower highs). The support lines and the resistant lines are now converging. This type of trendline convergence will result in a bullish market very soon.
Serum Market Price Statistic:
- SRM/USD price now: S0.777
- SRM/USD market cap: $204,096,956
- SRM/USD circulating supply: 263,244,669
- SRM/USD total supply:1,092,844,982
- SRM /USD coin market ranking: #132
Key Levels
- Resistance: $0.824 $0.850, $0.900
- Support: $0.715, $0.700 $0.650
Your capital is at risk
Serum Market Price Analysis: The Indicators’ Point of View
Traders begin to sell after the price reached above the height of the $0.800 support level. As a result of this, the MACD line crossed the signal line to the negative side. However the MACD line did not go too far; instead, it ranges sideways along with the MACD line. It will take an outlook from a smaller timeframe to be able to predict the soon possible direction of the market. From the MACD and the RSI we can see that the market is just trying to recover from the downside. Before we can call this market bullish, indicating lines must cross up above the point of equilibrium.
Serum: SRM/USD 4-Hour Chart Outlook
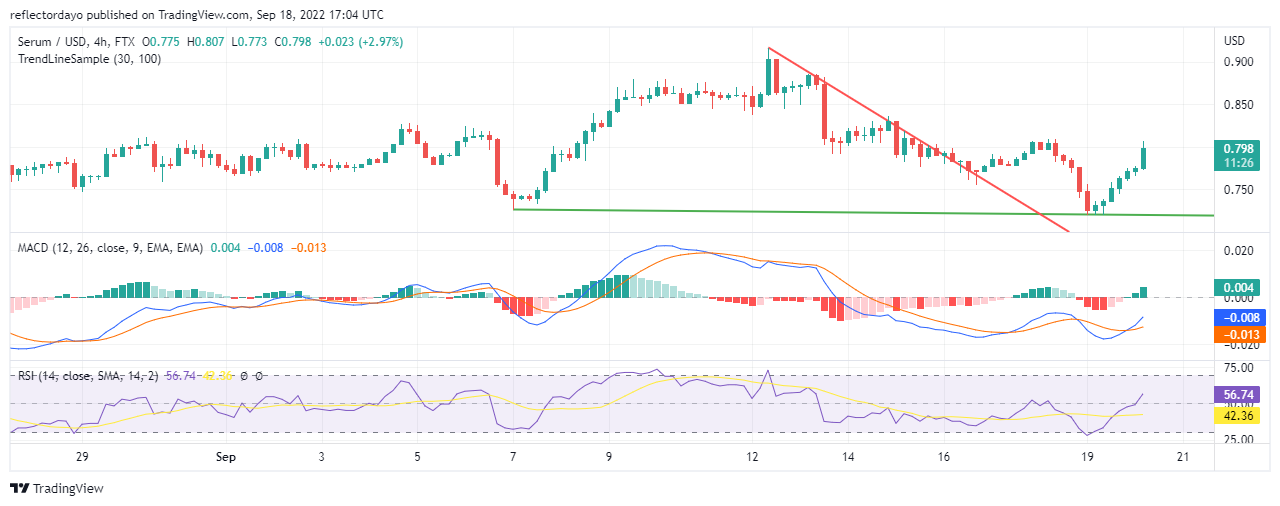
After the price bounced off the support trend line, it began to trend up. Now, it is like the market is forming resistance at $0.793. And because of this, the price consolidates briefly in this timeframe. The bullish trend seems to be weakening. And there is no sign of recovery yet. For now, the price is stable at the current price.
Related
Join Our Telegram channel to stay up to date on breaking news coverage


