Join Our Telegram channel to stay up to date on breaking news coverage
Lucky Block Price Prediction – September 18
On September 1, LBLOCK rallied to the high of $0.0018209 as it targets $0.0013633. The bullish momentum could not be sustained as the market reached the overbought region . Today, LBLOCK/USD has fallen to the low of $0.0005734 at the time of writing.
LBLOCK Price Statistics Data
LBLOCK price now – $0.0005448
LBLOCK market cap – $1,989,390
LBLOCK circulating supply –
LBLOCK Total Supply –
LBLOCK Coinmarketcap ranking – #3524
Key Levels:
Resistance levels: $0.0021, $0.0022, $0.0023
Support levels: $0.00200, $0.001900, $0.001800
LBLOCK/USD Medium-term Trend: Bearish (4-hour chart) – It Targets $0.0013633
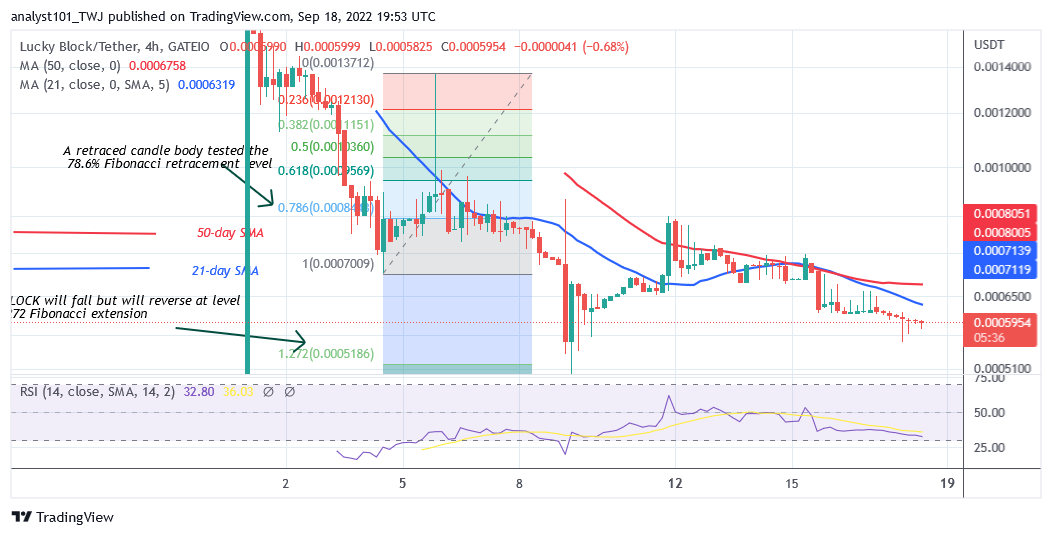
On September 15, the altcoin commenced a range-bound move as it targets $0.0013633. For the past four days, the price action has been characterized by small body indecisive candlesticks called Doji and Spinning tops. The candlesticks indicate that buyers and sellers have reached a period of indecision. The price movement is likely to remain stagnant as the market direction is unknown. On the upside, if the altcoin rebounds and breaks the moving average lines, it will signal the resumption of the uptrend.
LBLOCK/USD Medium-term Trend: Bearish (1-hour chart)
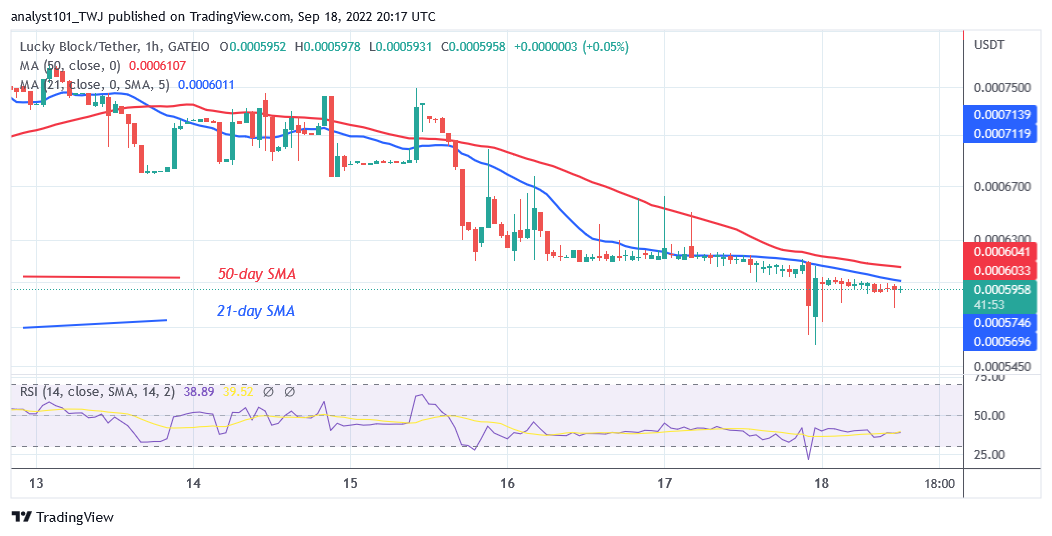
On the 1-hour Chart, LBOCK is in a downtrend as it targets $0.0013633. For the past four days, the altcoin has been trading below the moving average lines. The 21-day line SMA is acting as a resistance to the price bars. The crypto is at level 26 of the Relative Strength Index for period 14. It indicates that the coin has reached the overbought region of the market. Buyers will emerge in the oversold region.

You can purchase Lucky Block here. Buy LBLOCK
Related:
• How to buy Tamagoge
• Visit Tamadoge Website
Join Our Telegram channel to stay up to date on breaking news coverage


