Join Our Telegram channel to stay up to date on breaking news coverage
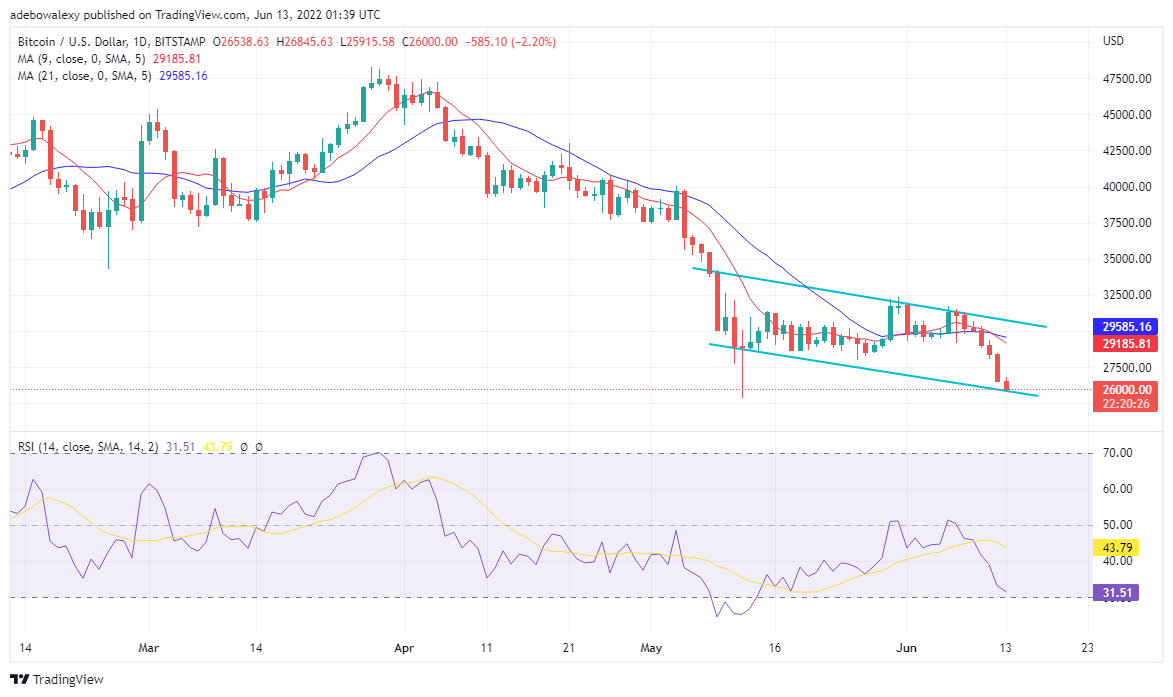
BTC/USD Price started sliding downwards to lower levels in April, as at then Bitcoin price was above $45,000. However, Currently BTC/USD trades within $29,000 – $25,000.
BTC Current Price: $26,000
BTC Market Cap: $465.5 Billion
Total Supply: 19.1 Million
Rank: 1
Key Levels:
Resistance: $31,560.30, $32,163.15, $42,271.50
Support: $27,776.03, $27,139.73, $26,000
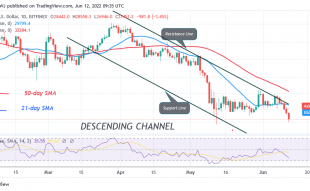
Generally, Bitcoin price action has been on a long bearish trend, which spanned from April till now and continues. The crypto king has been having a hard time trying to break the $34,000 price level.
Bitcoin Price Prediction: For How Long Will BTC Struggle Last?
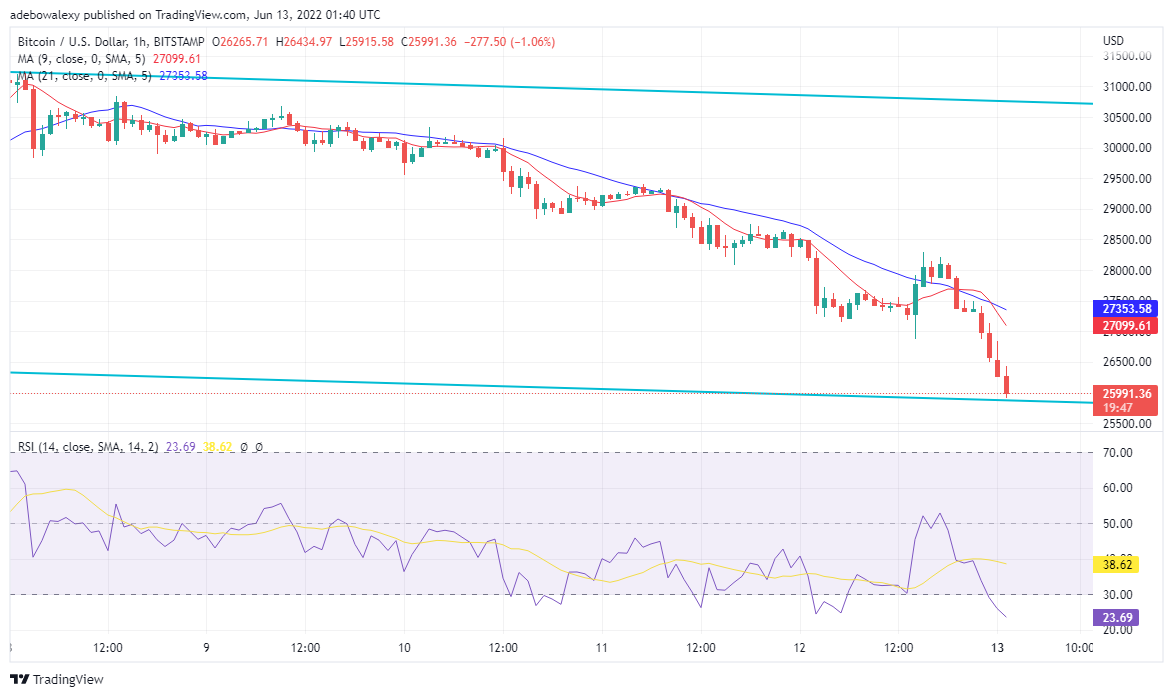
The BTC/USD price has been under the buffeting of the bears for a while. However, the bulls have made attempts to see the crypto rally past the $34,000 price level, but to no avail. Also, looking at the BTC/USD price action on the 1-hour chart, we see that it has crossed below the 9 and 21-days moving average. The crossing of the crypto’s price action below the MAs has sunk the crypto to lower price levels. In addition, The RSI indicator for this chart further confirms that Bitcoin price may see lower levels below $25,000. This is so because the fast and slow RSI lines are widely separated, as they head towards the oversold region.
Bitcoin Price Prediction: Will There Be a Turn of Events for BTC/USD Soon?
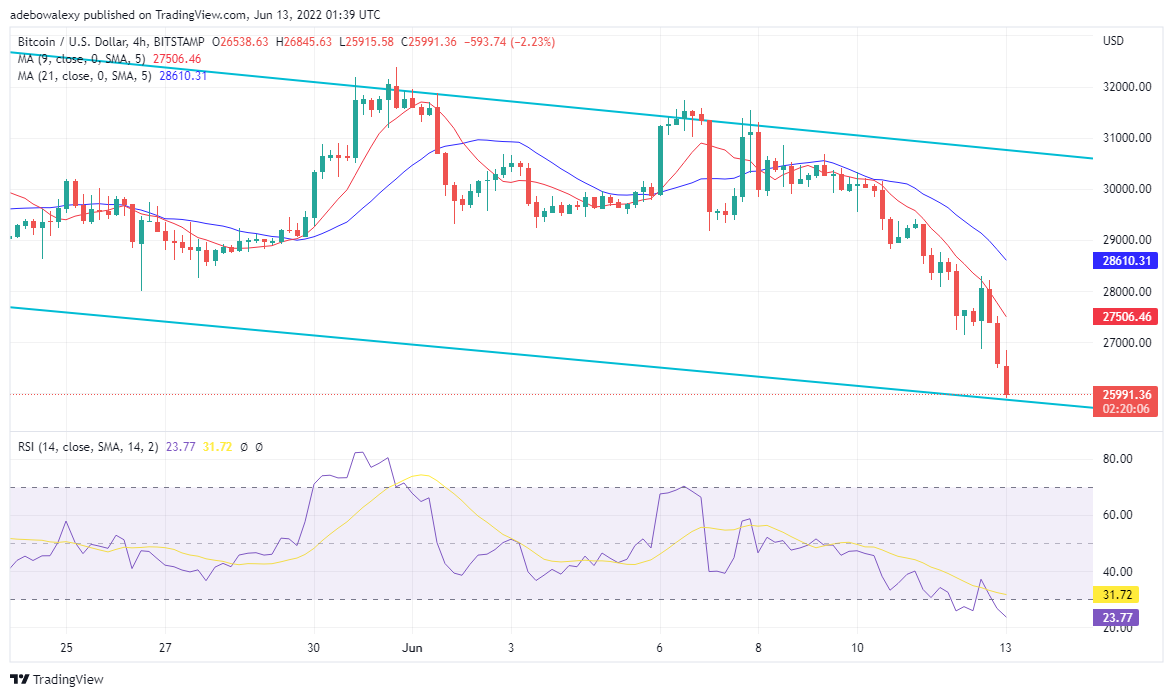
On the BTC/USD 4-hour chart, the 9-days MA moved closer to the price action: touching some candles. However, the Price level stayed at approximately $26,000.
Also on the RSI indicator: for this chart, the faster RSI line has reached the oversold region, and the slower RSI line is very close to the oversold region. As it stands, for BTC/USD to rally, dip buyers are needed to wary out the bears faster. Finally, the activities of buyers will pull the price up to $27,000 and perharps$28,000 respectively.
Join Our Telegram channel to stay up to date on breaking news coverage
