Join Our Telegram channel to stay up to date on breaking news coverage
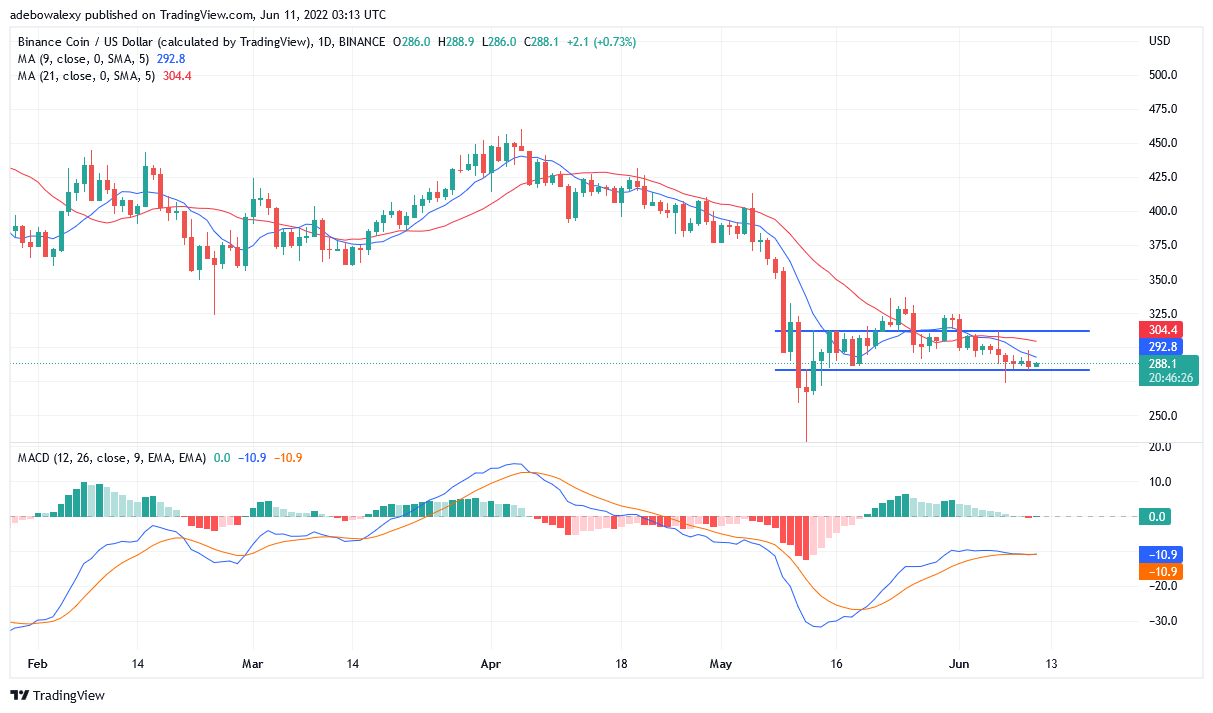
BNB’s price action appears to consolidate over a longer time frame. However, looking at shorter time frames some interesting move seems to be brewing up.
BNB Price Data:
BNB Current Price: $288.3
BNB Market Cap: $47.1 Billion
Circulating Supply: 163.3 Million
Total Supply: 163.3 Million
Rank: 5
Key Levels:
Resistance: $460.2, $520.4, $640
Support: $288.3, $333.2, $340
BNB/USD is currently ranging sideways, below the $300 price level. The ranging price action started ranging towards the middle of last month’s may. However, this consolidating movement is becoming more vivid.
Binance Price Prediction: BNB/USD Seems Prepared for an Uptrend
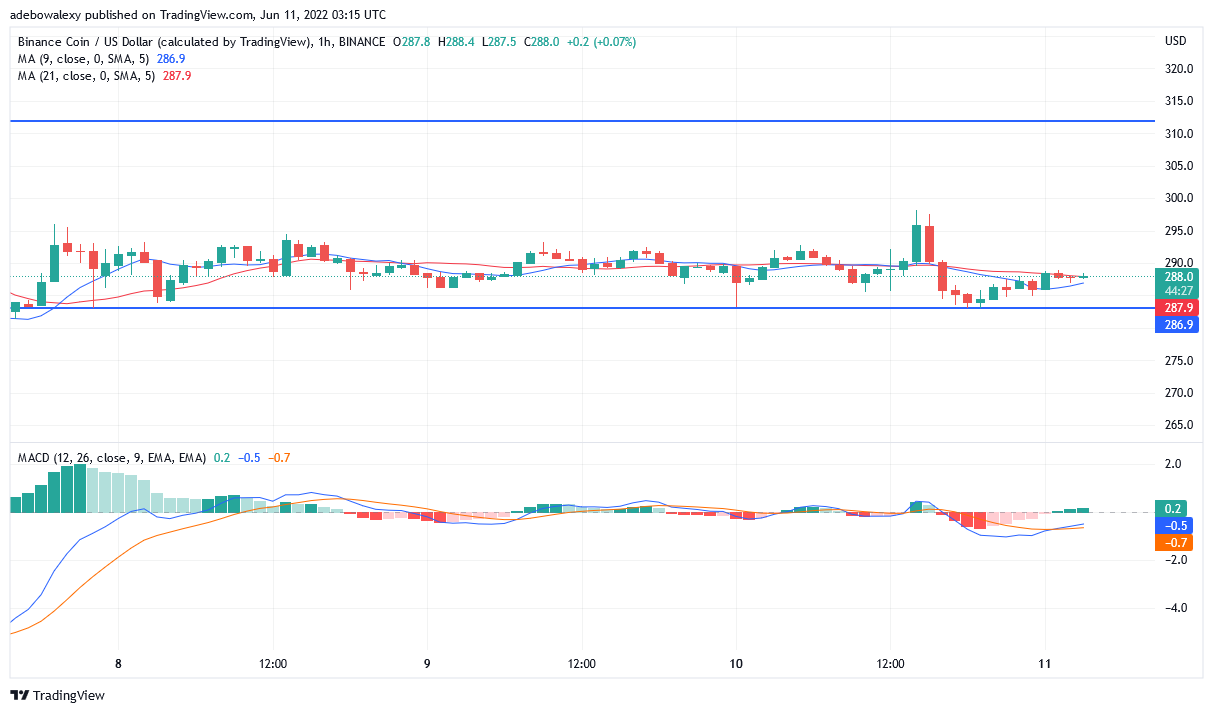
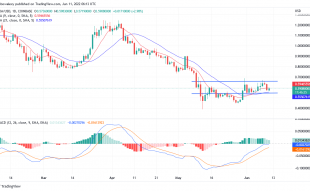
Let’s consider the BNB/USD On the 1-hours chart. On this chart, the Fast and slow MA (Moving Averages) have crossed and already moving apart. Also, on the BNB/USD chart, the price action has crossed above the fast MA: Blue line. In addition, looking closely we can see that the price action is also attempting to cross the slower MA. Lastly on this, considering the MACD indicator, the fast and slow EMAs (Exponential Moving Averages) have crossed as well. This implies that an uptrend might be very close. However, one might need to be cautious as the candle sticks indicate a tough battle between buyers and sellers.
Binance Price Prediction: BNB/USD Trend confirmation
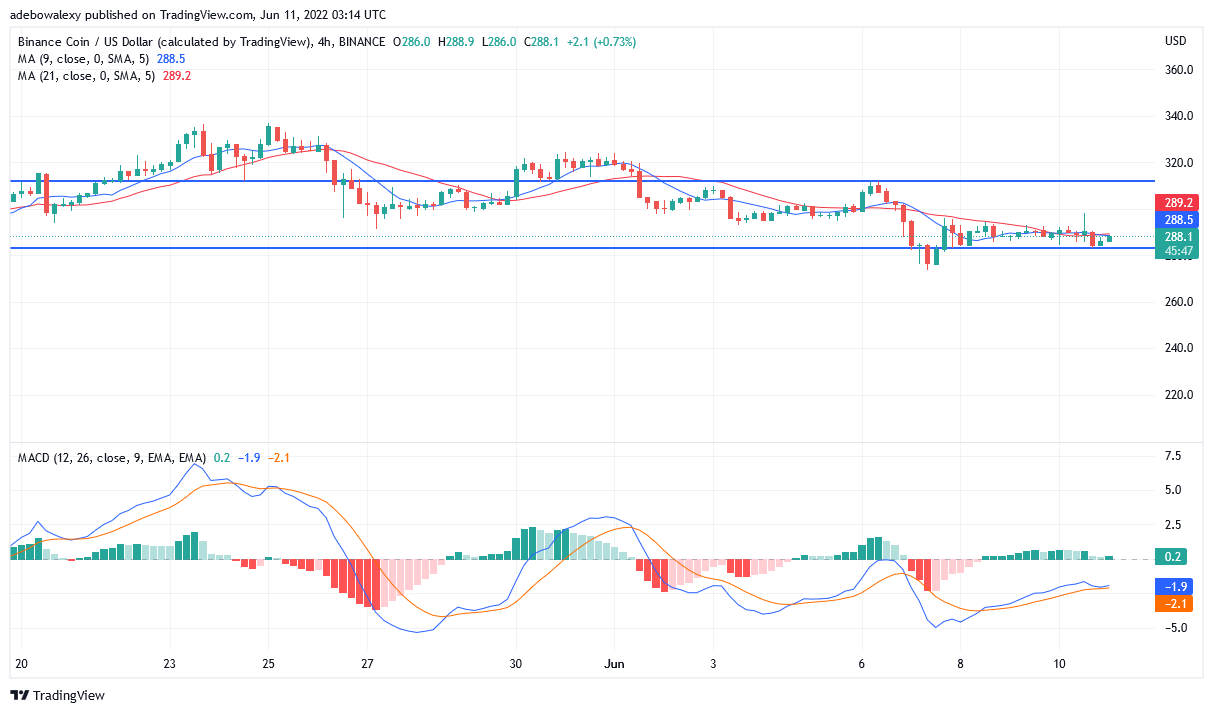
On the BNB/USD 4-hour chart, we can see that the MACD (Moving Average Convergence Divergence) fast and the slow EMA came so close at a point. Furthermore, we can see that the EMAs are moving apart. Also, we can observe a gradual growth of the histogram on the positive side. This also confirms that an Uptrend is close by. This new trend can see the BNB/USD price reaching beyond $300.
Finally, the price action will rally soon. Traders of BNB/USD can hitch on the trend early to rake in more profits.
Join Our Telegram channel to stay up to date on breaking news coverage
