Join Our Telegram channel to stay up to date on breaking news coverage
Bitcoin (BTC) Price Prediction – January 28
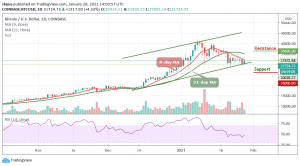
According to the daily chart, Bitcoin bulls are nurturing the uptrend towards the much-anticipated run-up to $35,000 resistance level.
BTC/USD Long-term Trend: Ranging (Daily Chart)
Key levels:
Resistance Levels: $36,500, $38,500, $40,500
Support Levels: $26,000, $24,000, $22,000
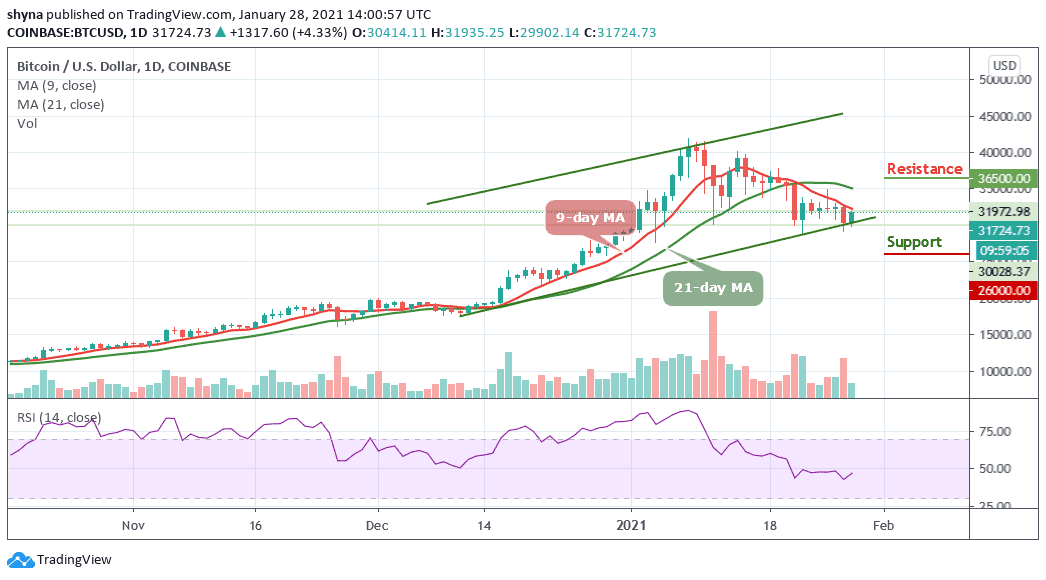
At the time of writing, BTC/USD is teetering at $31,972 and the coin is on the verge of the ultimate breakout to $32,000. However, the Bitcoin price started the day with a downside movement by touching the low of $29,902. BTC/USD price is now moving towards the 9-day MA as the coin improves in price movement at the moment.
What to Expect from Bitcoin (BTC)
BTC/USD is deciding around $31,724 below the 9-day and 21-day moving averages, where the buyers are anticipating a clear breakout. Meanwhile, the $33,000 and $35,000 levels may further surface as potential resistances should the $32,000 level holds. However, a strong bullish spike might take the price to $36,500, $38,500, and $40,500 levels.
Moreover, if the market decides to go down, Bitcoin’s price may drop to $28,000, and should this support fails to contain a sell-off, we may see a further roll back to $26,000, $24,000, and critically $22,000. The technical indicator RSI (14) is making an attempt to cross above the 50-level, suggesting additional bullish signals.
BTC/USD Medium-Term Trend: Ranging (4H Chart)
Looking at the chart, BTC/USD is clearly facing a lot of resistance near the $32,200 and $32,500 level. A successful close above the $32,800 level is a must for bullish acceleration. If not, there is a risk of a downside extension below the 9-day moving average. If there is a downward move, initial support is near the $30,500 level and the main support is near the $30,000 level, below which there is a risk of another decline towards $28,000.
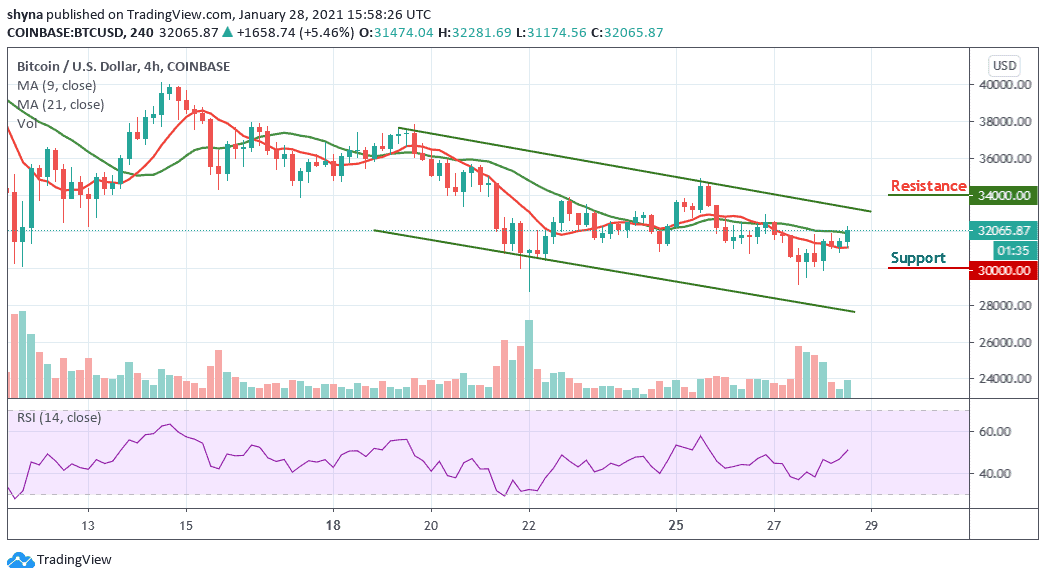
Furthermore, if there are more gains, the $33,000 level is likely to act as a major hurdle in the near term for Bitcoin. So if there is an upside break above the $33,500 resistance, the next stop for the bulls may perhaps be near the $34,000, $35,000, and $36,000 resistance levels as the RSI (14) moves around the 51-level.
Join Our Telegram channel to stay up to date on breaking news coverage