Join Our Telegram channel to stay up to date on breaking news coverage
Bitcoin (BTC) Price Prediction – December 28
Bitcoin (BTC) price is trading above the $27,000 and the coin must climb above the $28,000 resistance to continue higher.
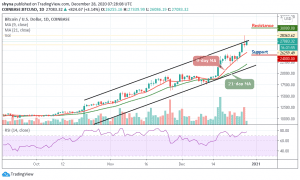
BTC/USD Long-term Trend: Bullish (Daily Chart)
Key levels:
Resistance Levels: $30,000, $30,200, $30,400
Support Levels: $24,000, $23,800, $23,600

BTC/USD started the day with a downside movement as the coin touched $26,086 in the early hours of today, but later, BTC/USD market started improving, moving out of the downside to the upside. However, since the beginning of this month, BTC/USD has moved up from $18,778 to $27,477 and now changing hands at $27,083.
Where is BTC Price Going Next?
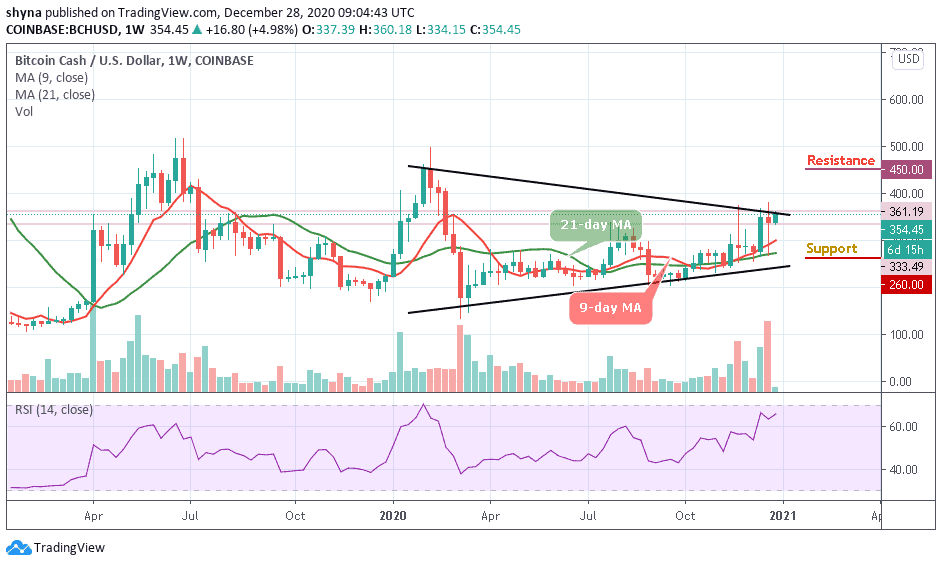
BTC/USD is making an attempt to climb higher above the $27,000 resistance as the technical indicator RSI (14) remains within the overbought region. In 2021, if the new bullish movements are beginning to form, buyers could use the 9-day MA as the nearest support level. But in as much as the red-line of 9-day is above the green-line of 21-day MA, the market price will remain in the upward movement.
On the other hand, if the market begins a downward movement, Bitcoin’s price may drop to $25,000, and should this support fail to contain the sell-off, traders may see a further drop to $24,000, $23,800, and critically $23,600. The resistance levels to watch are $30,000, $30,200, and $30,400 respectively. Meanwhile, the signal line of RSI (14) stays within the overbought zone, suggesting more bullish signals.
BTC/USD Medium – Term Trend: Bullish (4H Chart)
According to the 4-hour chart, Bitcoin’s price is currently trading around $27,092 and around the 9-day MA after touching the daily high of $27,477. Meanwhile, we can see that the bullish movement is still very intact in the market as the bears are also trying to bring the price down.
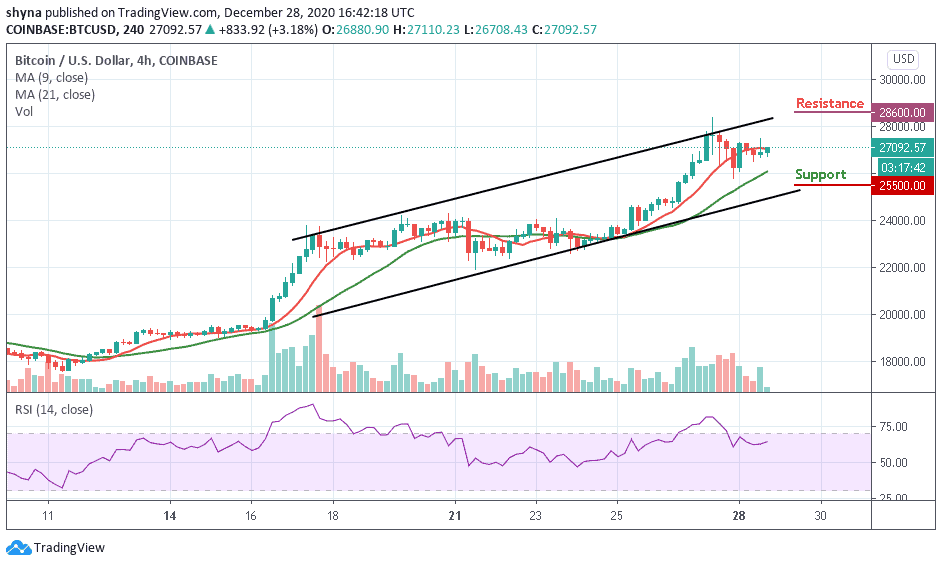
However, if the buyers could put more pressure, they can further push the price to a $28,500 resistance level. Therefore, breaking the mentioned resistance may allow the bulls to test the $28,600 and above. Meanwhile, the RSI (14) is currently moving above the 60-level, but any movement towards the south may bring the sellers and any further bearish movement could lead to the support of $25,500 and below.
Join Our Telegram channel to stay up to date on breaking news coverage