Join Our Telegram channel to stay up to date on breaking news coverage
XRP Price Prediction – December 28
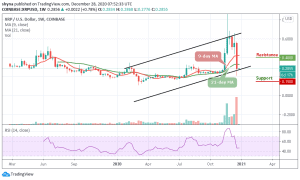
According to the weekly chart, the Ripple price is currently correcting higher, but the coin remains to sell on rallies near $0.25.
XRP/USD Market
Key Levels:
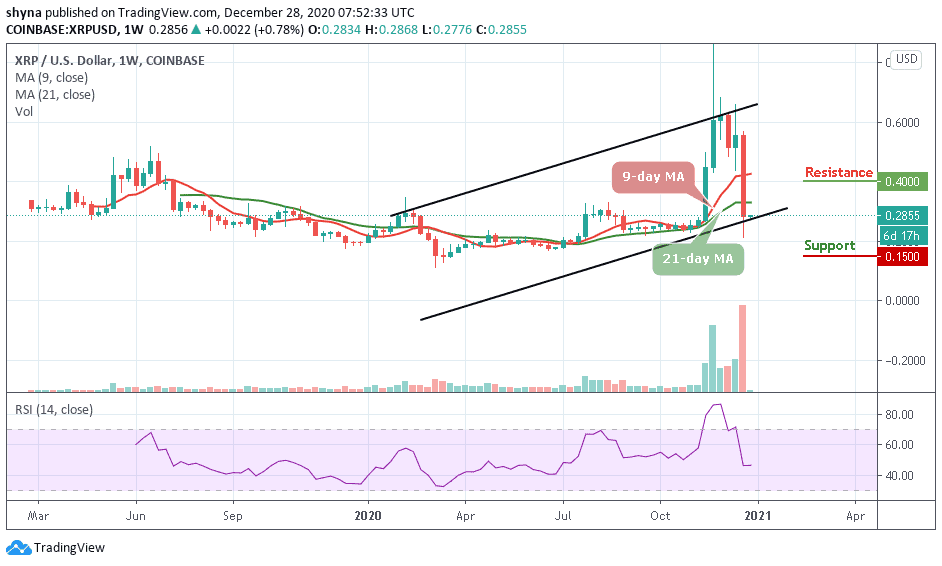
Resistance levels: $0.40, $0.45, $0.50
Support levels: $0.26, $0.24, $0.22
XRP/USD hit the yearly high at $0.92 in November 2020 but in the last few weeks, the bears opposed the price increase with the formation of a strong bearish candle that engulfs the previous candle; the price now dropped to a $0.21 price level of which there may be a pullback if the bulls regroup and put more effort in the coming year 2021.
What to Expect from Ripple (XRP) in 2021
The bulls opened the Ripple market with $0.19 this year 2020 and it was bullish throughout the month of January. The resistance level of $0.34 was tested in the month of February after the scenario was the formation of bearish candles which decline the price to $0.11 in March. The price pulls back in July to retest the $0.32 level. More so, XRP/USD has been flashing some signs of weakness throughout the past few weeks, with the selling pressure seen around the $0.30 region proving to be too significant for the cryptocurrency to surmount.
According to the weekly chart, the Ripple price is trading below the 9-day and 21-day moving averages. Therefore, as the RSI (14) moves below the 50-level, further decline in the bears’ momentum may push the price to penetrate the $0.20 level, then, the support levels of $0.15, $0.10, and $0.005 may be reached. In the coming year 2021, if the bulls push the price above the moving averages, XRP/USD may begin a new bullish movement towards the resistance levels of $0.40, $0.45, and $0.50.
Against Bitcoin, on the weekly chart, the decline has continued and all support at the 2000 SAT has broken down. The price is set to test 800 SAT if Bitcoin’s gains continue to impact the Ripple price. Meanwhile, the bears remained the dominant of the market as the sellers continued to put pressure on the market.
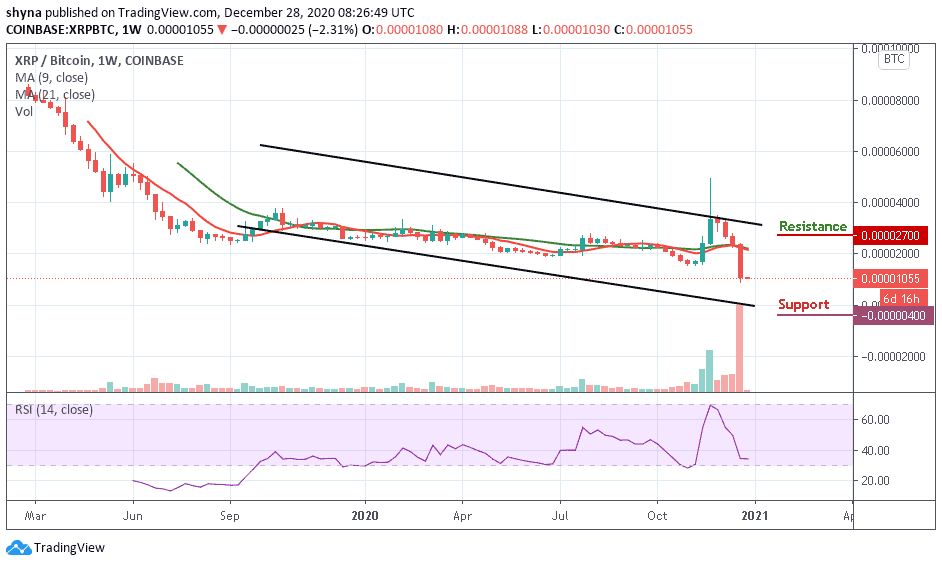
However, if the sellers occupy their positions, XRP/BTC may drop to the support level of 400 SAT and below. At present, the RSI (14) is currently trading below the 35-level, suggesting more bearish signals. Any bullish movement above the 9-day and 21-day moving averages could reach the resistance level of $2700 and above.
Join Our Telegram channel to stay up to date on breaking news coverage