Join Our Telegram channel to stay up to date on breaking news coverage
XRP Price Prediction – December 10
Ripple (XRP) is down by 0.91% in the last 24 hours as the value has gone below $0.58.
XRP/USD Market
Key Levels:
Resistance levels: $0.68, $0.73, $0.78
Support levels: $0.45, $0.40, $0.35
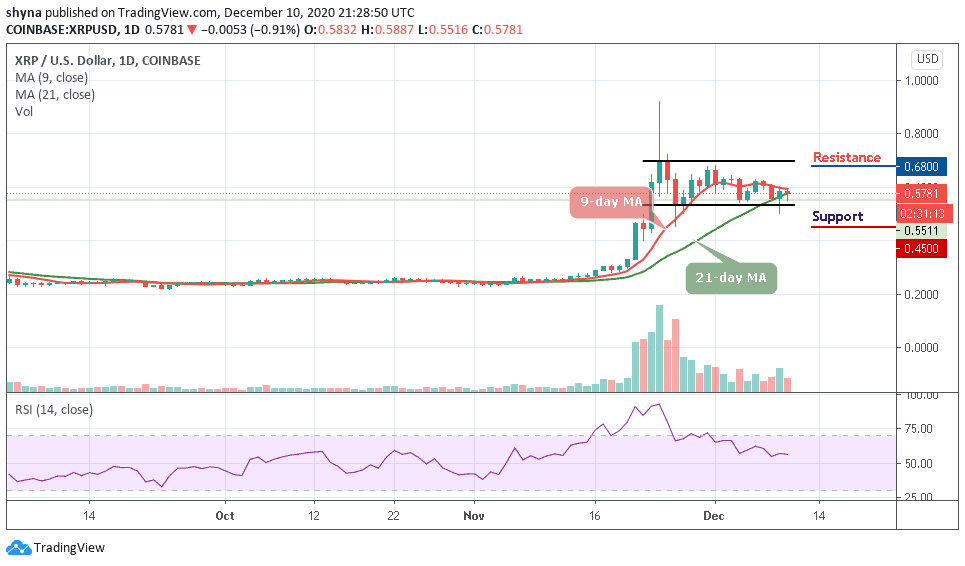
Earlier today, XRP/USD touches the daily high of $0.58 before giving a bearish signal at the time of writing, the coin is also floating below the 9-day and 21-day moving averages as the technical indicator RSI (14) moves above 55-level. Meanwhile, a break below the channel could give the market enough strength to dig dip, but moving towards the north might lead the market to a bullish scenario.
Where is the Ripple Price Heading to?
At the moment, the Ripple price has continued to demonstrate a sign of weakness across its markets. Looking at the daily chart, XRP/USD market is down by 0.91%, reflecting a price drop in the market and the fall might become heavy if the bearish action continues. Meanwhile, the Ripple (XRP) has been consolidating within the channel since November 24.
Therefore, if XRP/USD moves bullishly on short-term outlook, traders may expect the trend to keep advancing higher if the price actions still remain inside the channel. A breakout above the moving averages could strengthen bulls and push the market price to the resistance levels of $68, $73, and $78, or a channel breakdown might lead the market in a bearish scenario if the price continues to fades and the closest supports to keep an eye on are $0.45, $0.40, and critically $0.35.
Against BTC, XRP has remained intact within the channel. If the selling pressure continues, the Ripple price may likely create a new monthly low. At the moment, the signal line of RSI (14) is seen moving in the same direction around the 49-level; traders could see a negative move if XRP crosses below the moving averages.
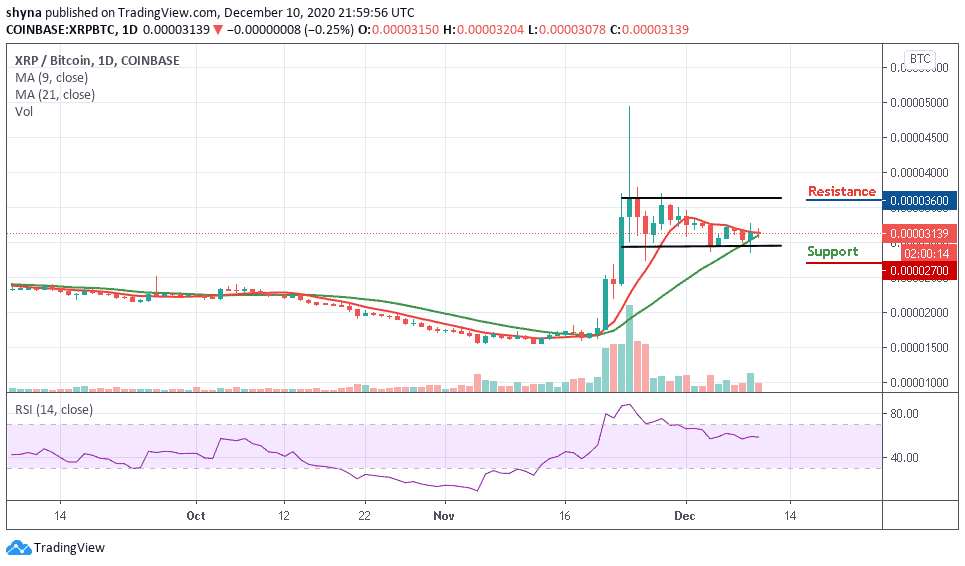
As the daily chart reveals, XRP/BTC is currently moving at 3139 SAT. We may expect close support at the 3000 SAT before breaking to 2700 SAT and critically 2500 SAT levels. Should in case a bullish movement occurs and validates a break above the moving averages; a bull-run can be confirmed for the market and the nearest resistance levels could be found at 3600 SAT and above.
Join Our Telegram channel to stay up to date on breaking news coverage