Join Our Telegram channel to stay up to date on breaking news coverage
The Bitcoin price prediction shows BTC trading within a descending channel, with recent price action attempting to break above the moving averages, indicating potential bullish momentum.
Bitcoin Prediction Data:
- Bitcoin price now – $83,364
- Bitcoin market cap – $1.65 trillion
- Bitcoin circulating supply – 19.85 million
- Bitcoin total supply – 19.85 million
- Bitcoin Coinmarketcap ranking – #1
Getting in early on a crypto project can be a game-changer, and Bitcoin (BTC) is the ultimate proof. Since its all-time low of just $0.002747 on July 14, 2010, BTC has skyrocketed by an unbelievable +171,164,206.77% – a return that turns mere pennies into fortunes. While its price has seen some correction from its all-time high of $109,114.88 in January 2025, today’s 24-hour range between $80,749.81 and $84,247.47 still reflects its massive long-term growth. Bitcoin’s journey shows just how powerful early adoption in crypto can be.
BTC/USD Long-term Trend: Bearish (Daily Chart)
Key levels:
Resistance Levels: $92,000, $94,000, $96,000
Support Levels: $75,000, $73,000, $71,000
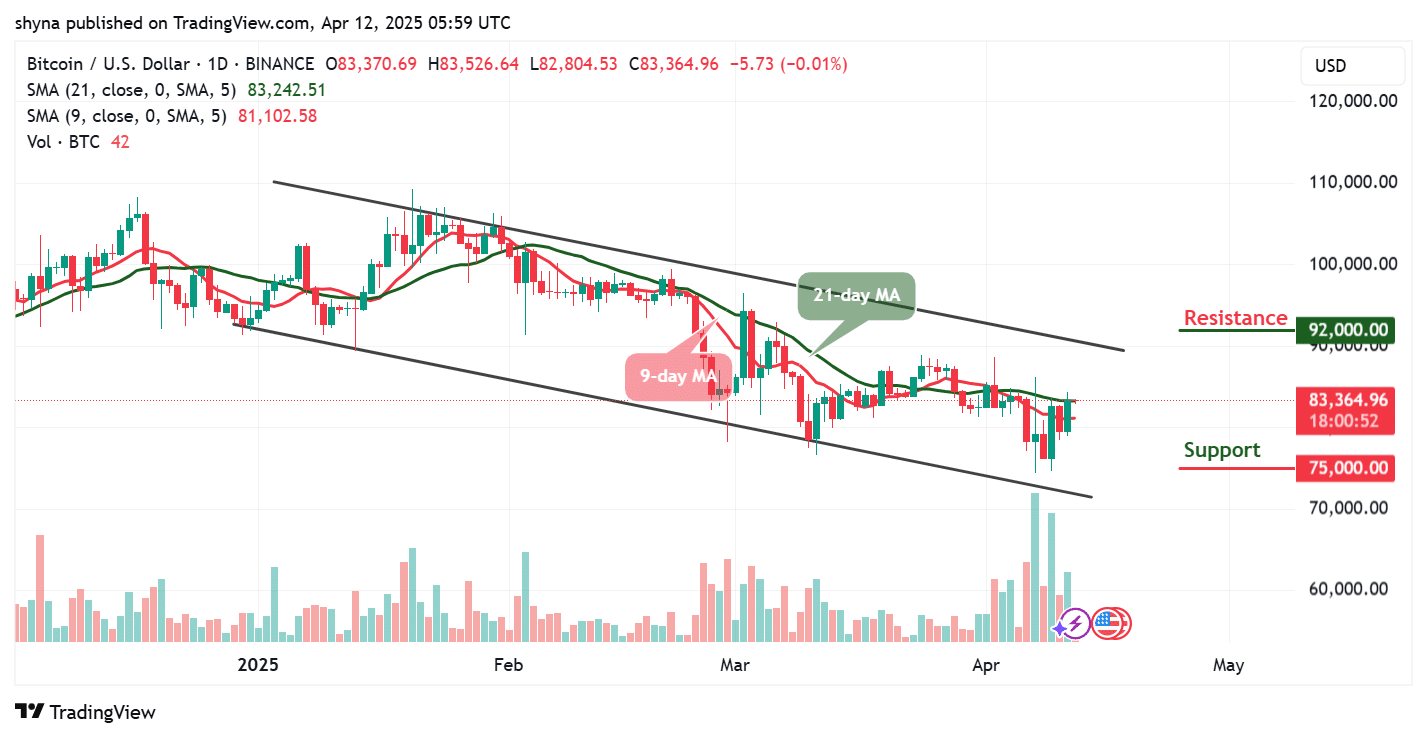
BTC/USD remains in a bearish posture over the long term, as seen by the descending channel forming lower highs and lower lows on the daily chart. The market price continues to struggle below the upper boundary of the channel, indicating that sellers remain in control despite recent bullish attempts.
Bitcoin Price Prediction: Will Bitcoin Maintain the $83K Zone or Slide Further?
At the time of writing, Bitcoin trades around $83,364, slightly above the 9-day MA ($81,102) and very close to the 21-day MA ($83,242). This narrow gap between the MAs suggests ongoing indecision and a lack of clear bullish momentum. While a short-term bounce is evident, BTC remains confined within a well-defined descending channel that has capped every major upside attempt since mid-February. For a bullish reversal to gain traction, BTC must convincingly break above the $83,500 level and sustain price action above the $85,000 psychological barrier. A successful breakout from the descending channel could propel the price toward resistance levels at $92,000, $94,000, and $96,000.
Will Bitcoin Crash Again?
On the downside, failure to maintain support above the $82,000 zone may prompt a retest of the lower trendline around $80,000. A breakdown below these levels could expose the market to critical supports at $75,000, $73,000, and $71,000, respectively. However, given the current pattern and resistance near the channel’s upper boundary, the market remains vulnerable to further downside unless bulls push for a breakout in the coming sessions.
BTC/USD Medium-term Trend: Bearish (4H Chart)
The 4-hour BTC/USD chart shows Bitcoin steadily climbing, now trading above both the 9-day and 21-day moving averages. The price has recently tested the upper boundary of the descending channel but has yet to achieve a strong breakout. This bullish pressure suggests potential for a retest of the $85,000 zone, and if buyers maintain their momentum, BTC may surge toward the key resistance level of $88,000 and above.
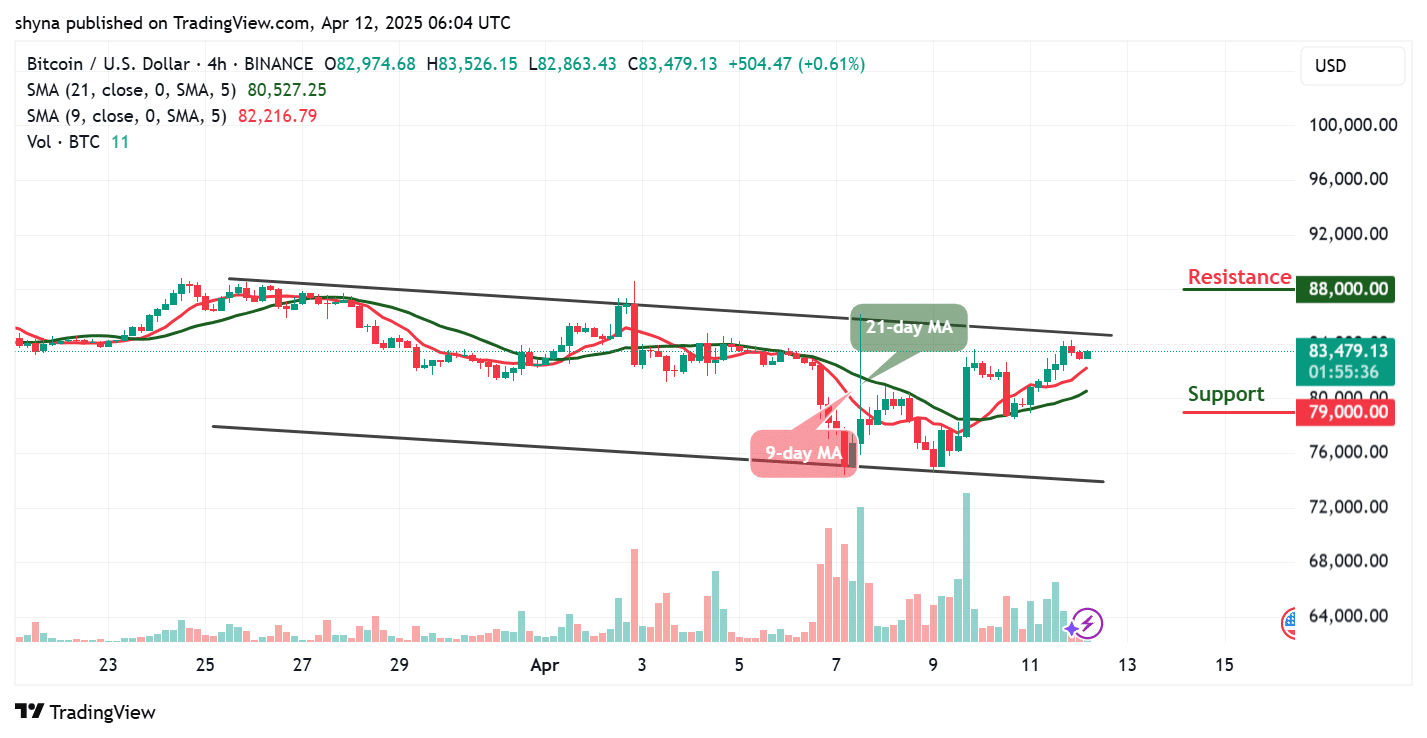
Nevertheless, with the 9-day MA comfortably above the 21-day MA, bullish sentiment remains intact. Meanwhile, a rejection from the channel resistance could trigger a minor retracement. If selling pressure increases and BTC slips below the moving averages again, the price could revisit the $80,000 support area, with further downside potential toward $79,000 and $76,000. For now, upward continuation remains likely unless short-term volatility disrupts the current trajectory.
Meanwhile, Crypto analyst @CryptoCaesarTA, who has over 133,000 followers on X (formerly Twitter), highlighted that Bitcoin ($BTC) is currently trading at key support levels, with particular focus on the green and blue zones as critical areas to watch for potential price movement.
$BTC – #Bitcoin is trading at major support levels. I’m watching the green and blue zones. pic.twitter.com/CT1iKQC9dq
— Crypto Caesar (@CryptoCaesarTA) April 9, 2025
Bitcoin Alternatives
The BTC/USD daily chart continues to show a bearish trend, with price action confined within a descending channel marked by lower highs and lower lows, suggesting that sellers still dominate the market despite brief bullish efforts. In contrast, Best Wallet, a utility token in its presale phase, has raised $11.6 million and offers a fully functional wallet application with a wide range of features. It allows investments using Ethereum, Tether, and popular meme coins like Shiba Inu, Pepe, and Dogecoin, and supports high-yield staking. With growing user adoption and practical utility, Best Wallet stands out as a promising long-term project.
New Best Wallet Coin To Buy Now – Update on This 100X Potential Presale
Investors can use Ethereum, Tether, and even popular meme coins such as Shiba Inu, Dogecoin, and Pepe to purchase the token, bringing real use cases to these assets. In addition, Best Wallet supports the purchase of major cryptocurrencies like Bitcoin, adding further utility and convenience for users. With a high-stakes yield and growing adoption, Best Wallet is positioning itself as a powerful all-in-one platform in the DeFi space. As the crypto market trends upward, this is a strategic moment to invest in a utility token backed by a live product and increasing user engagement.
Related News
- Bitcoin Price Prediction: BTC Soars 8% After Trump Announces 90-Day Tariff Pause For Certain Countries
- A Warren Buffett Move In Crypto? Best Wallet Amasses $11.6 Million To Drive The Next Market Cycle
Best Wallet - Diversify Your Crypto Portfolio

- Easy to Use, Feature-Driven Crypto Wallet
- Get Early Access to Upcoming Token ICOs
- Multi-Chain, Multi-Wallet, Non-Custodial
- Now On App Store, Google Play
- 250,000+ Monthly Active Users
Join Our Telegram channel to stay up to date on breaking news coverage
