Join Our Telegram channel to stay up to date on breaking news coverage
The Yearn.finance (YFI) price prediction sees a 5.25% price increase as the cryptocurrency touches $8,018 resistance.
Yearn.finance Prediction Statistics Data:
- finance price now – $7,864.3
- finance market cap – $285.3 million
- finance circulating supply – 36.6 million
- finance total supply – 36.6 million
- finance Coinmarketcap ranking – #106
YFI/USD Market
Key Levels:
Resistance levels: $10,000, $11,000, $12,000
Support levels: $6,000, $5,000, $4,000
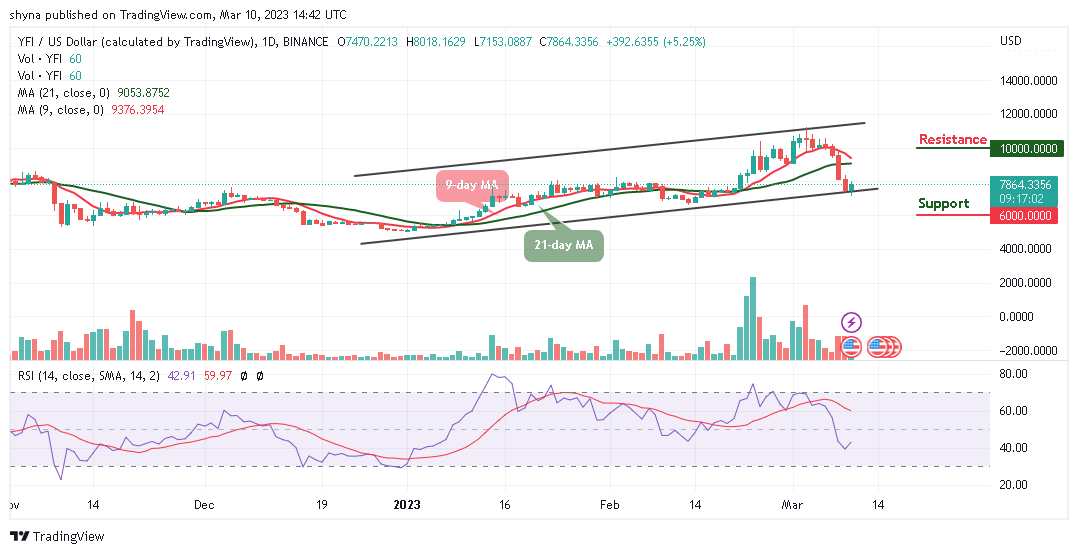
YFI/USD gains a 5.25% price rise over the past 24 hours of trading as the cryptocurrency bounced from $7,153 to the $8,018 resistance level. The Yearn.finance may face the upside if the red line of the 9-day MA remains above the green line of the 21-day MA. At the time of writing, the movement is shifting back into the bullish favor, with the technical indicator Relative Strength Index (14) moving to cross above the 50-level.
Yearn.finance Price Prediction: Yearn.finance (YFI) Ready for a Spike
The Yearn.finance (YFI) price is likely to rise above $8,500 if the buyers push the price above the 9-day and 21-day moving averages. On the other hand, traders may consider the market as bearish if the sellers take the market movement to cross below the lower boundary of the channel.
However, if the coin follows the upside, the first level of resistance could be found at $9,000, while the potential resistance levels lie at $10,000, $11,000, and $12,000. Moreover, if the sellers push the price beneath the lower boundary of the channel, traders may expect support at $6,000, $5,000, and $4,000 but the technical indicator Relative Strength Index (14) faces the north to give more bullish signals.
Against Bitcoin, YFI is moving to cross above the 9-day moving average. According to the daily chart, the coin is likely to continue the bullish movement and the nearest resistance level could touch 4500 SAT. Above this, higher resistance lies at 5000 SAT and above.
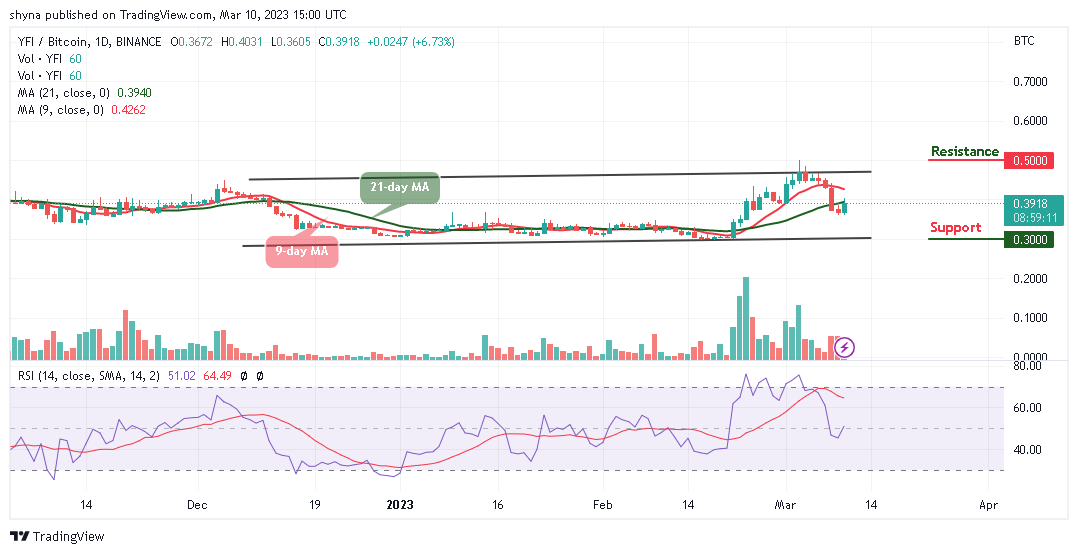
On the other hand, if the selling pressure creates a fresh low below the lower boundary of the channel, lower support may be found at 3000 SAT and below. Meanwhile, the technical indicator Relative Strength Index (14) is moving to cross above the 50-level, which shows that the market is preparing for an upward movement.
Yearn.finance Alternatives
Yearn Finance has been attempting a recovery during the past 24 hours. The uptrend is coming up slowly, showing signs of holding because of the growing buyer support. In this case, YFI could test the next resistance at $10,000 if the bulls increase the buying pressure. On that note, Fight Out is on a mission to transform the, up to now, dominant Web 2.0 setup, but also to overcome weaknesses it has identified with Web 3.0 Move-to-Earn as currently implemented by projects. However, the token has raised almost $5.5 million in the ongoing presale.
Join Our Telegram channel to stay up to date on breaking news coverage