Join Our Telegram channel to stay up to date on breaking news coverage
XRP Price Prediction – April 18
Ripple price is facing an increase in selling pressure below the $0.228 resistance against the US dollar.
XRP/USD Market
Key Levels:
Resistance levels: $1.75, $1.85, $1.95
Support levels: $0.85, $0.75, $0.65
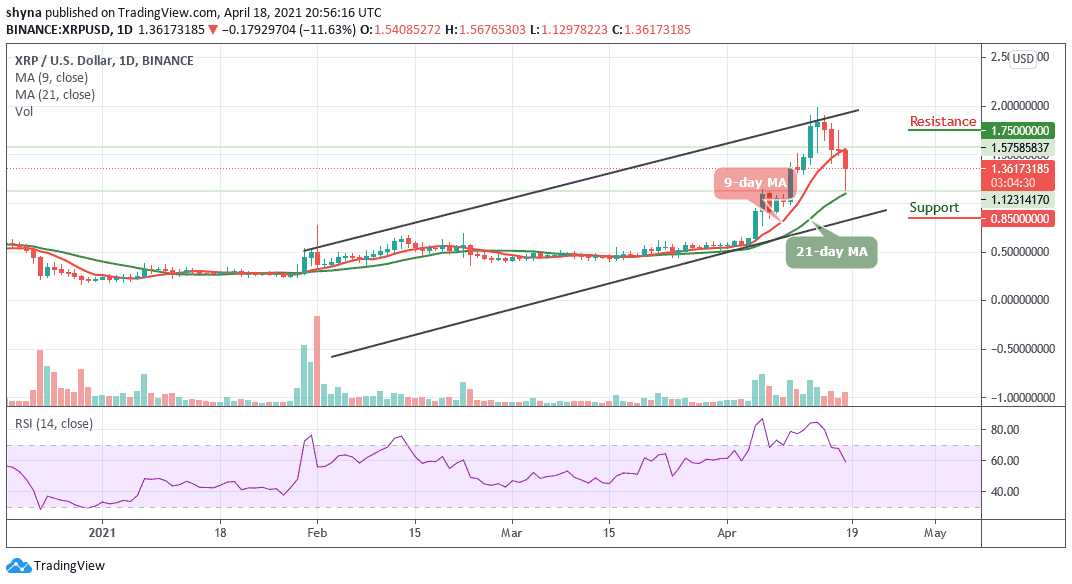
XRP/USD is slowly declining below key supports and the price might revisit the $0.1.120 support before it could start a fresh increase. After struggling to stay above $0.130, Ripple started a slow and steady decline. The coin is trading within the 9-day and 21-day moving averages to create a short-term bearish zone.
What is the Next Direction for Ripple?
XRP/USD is currently changing hands at $0.136 and any attempt to make it cross below the 21-day moving average may open the doors for more downsides and the price could spike below the $0.100 support level. However, for the uptrend, traders should keep an eye on this level before creating a new bullish trend at the resistance levels of $1.75, $1.85, and $1.95.
However, the market may experience a quick buy once the trade reaches the support at $1.100. And should the price fails to rebound, then a bearish breakout is likely to trigger more selling opportunity for traders, which might cause the price to reach $0.85 and could further drop to $0.75 and $0.65 support levels respectively. The RSI (14) nosedives below 60-level. If the price falls more, it may likely create additional downtrends.
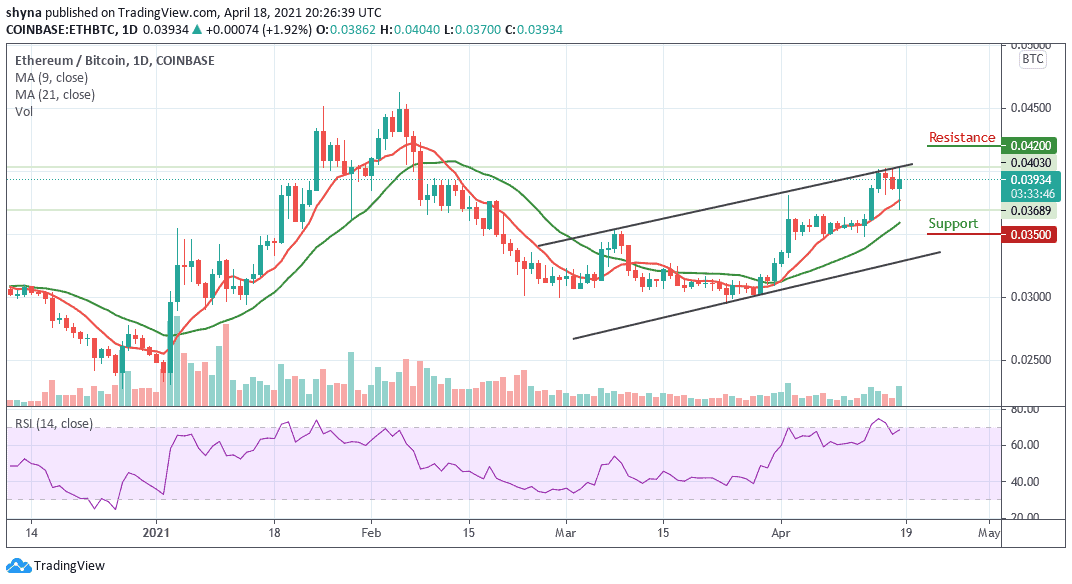
When compares with Bitcoin, XRP is currently trading at 2422 SAT and it’s trading under the 9-day moving average. If the above-mentioned level could serve as market support, the price can be pushed up towards the resistance level of the 2700 SAT. By reaching this level, the price may likely visit 2900 SAT and 3000 SAT resistance levels.
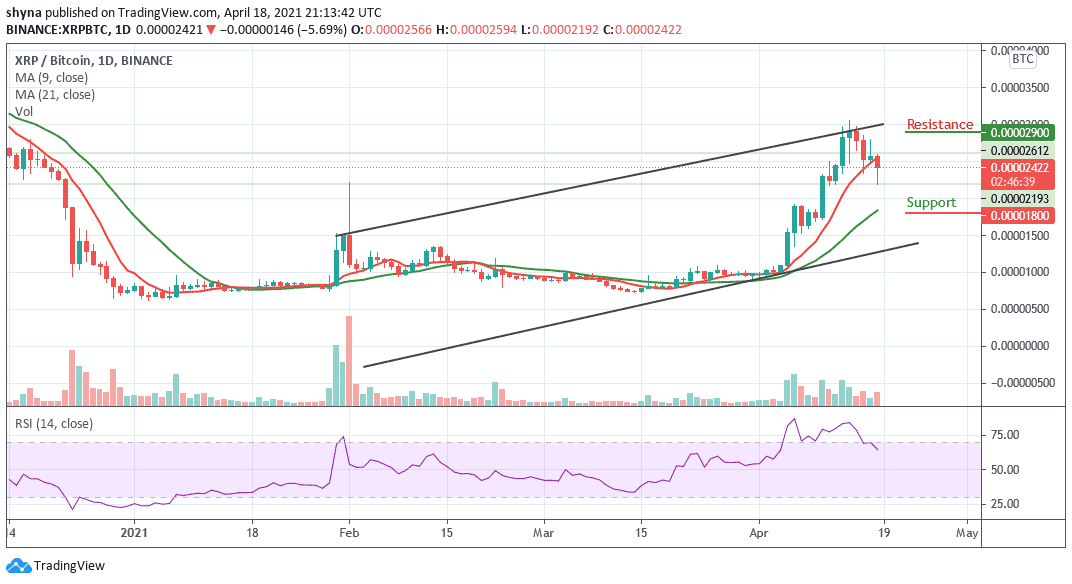
However, if the bulls fail to push the price to the nearest resistance, the market may continue a downtrend and the pair could probably record further declines at 2000 SAT. Breaking this level could push the market to the nearest support levels at 1800 SAT and below. Meanwhile, the RSI (14) is moving below 70-level, which may continue to give more bearish signals.
Join Our Telegram channel to stay up to date on breaking news coverage