Join Our Telegram channel to stay up to date on breaking news coverage
Ripple has witnessed a significant value increase, which started around the middle of July. Subsequently, this uptrend has reversed to a downward correction not quite long from now. Although the price candle stays within the reach of being caught up in an upward reversal, there is a need for caution in this market.
On the other hand Tamadoge (TAMA) is experiencing a high demand in its current presale stage.
XRP Forecast Statistics Data:
XRP’s current price: $0.3645
XRP market cap: $17.7 billion
XRP circulating supply:48.34 billion
XRP total supply: 99.99 billion
XRP Coinmarketcap ranking: #7
Therefore, in this forecast we shall examine this market, using trading indicators. This is done to further discover what to anticipate in both XRP/BTC and XRP/USD markets. Eventually, this will serve as a guide to making wise trading decisions in this market.
Major Price Levels:
Resistance levels: $0.3640, $0.3720, $16790
Support levels: $0.3612, $0.3609, $0.3645
Ripple May Have Started a Strong Downtrend While Tamadoge Demand Grows
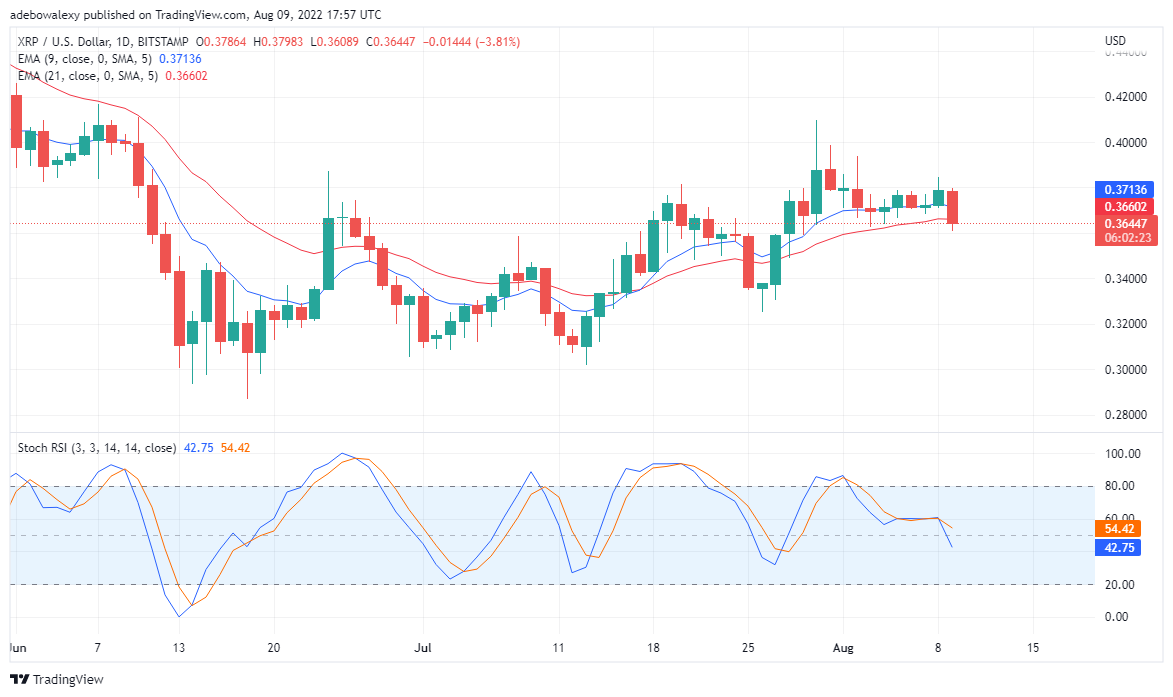
On the above XRP/USD chart we can see that price of this crypto has begun a downward correction. This inference is drawn from the fact that the initial uptrend started getting weaker, as the EMA curves started touching price candles. And, now we can see that selling pressure fathered the formation of a big bearish candle. Subsequently, this plunged the price of Ripple.
Furthermore, it could be observed that the Stochastic RSI indicator curves have started to plunge downwards at the 60% mark. This is telling that the strength of the uptrend has reversed. Eventually, more bullish candles will be formed on the Ripple chart and its price will search for lower support from here. Therefore, traders should place their stop around $0.3500, perhaps the uptrend may resume, should buying pressure correct the trend upwards.
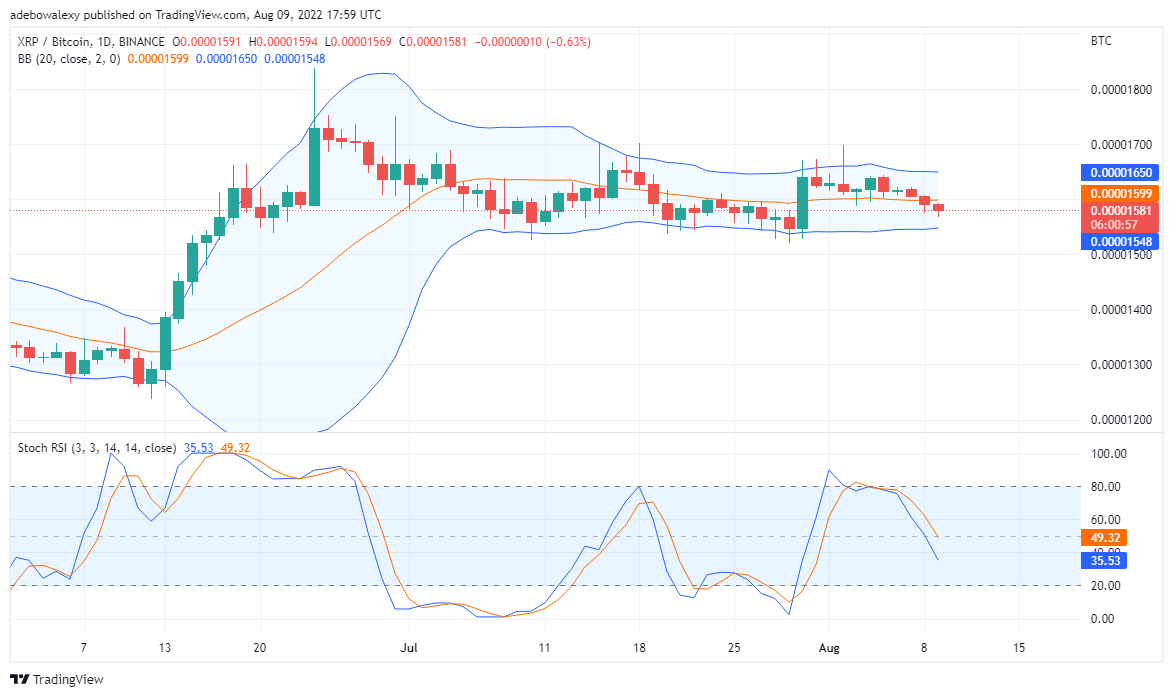
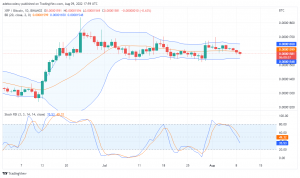
Ripple Downtrend Appears More Pronounced Against BTC
Applying the Bollinger indicator on the XRP/BTC chart, we can see the aforementioned downtrend has extended to this market. Bearish candles can be seen trickling down the middle band of this Indicator. Consequently, this signifies that this market is in a downtrend.
Also, the Stochastic RSI curves can be seen pointing downwards into the oversold zone. Also, the curves of this Indicator seem to straighten at the terminal, this shows that there are no signs of a reversal for now. Furthermore, the value of this pair may find new support around 0.00001500. Finally, traders may consider going short on this market.
Join Our Telegram channel to stay up to date on breaking news coverage