Join Our Telegram channel to stay up to date on breaking news coverage
XPTUSD Price Analysis – August 03
The bullish trend may resume should the demand level of $833 holds. In case the Bears break down the demand level of $833, the price may decrease towards the demand level of $776.
XPT/USD Market
Key levels:
Supply levels: $898, $962, $1,030
Demand levels: $833, $776, $714
XPTUSD Long-term trend: Bullish
On the weekly chart, XPTUSD is bullish. Three weeks consecutively Platinum has been bullish; that is the Platinum price has been increased to the extent that former supply level of $833 was broken upside and the price incline towards the supply level of $898. Last week was different; there was a pullback of price by the Bears towards $833 level. The Bears dominated last week market and the market closed bearish.
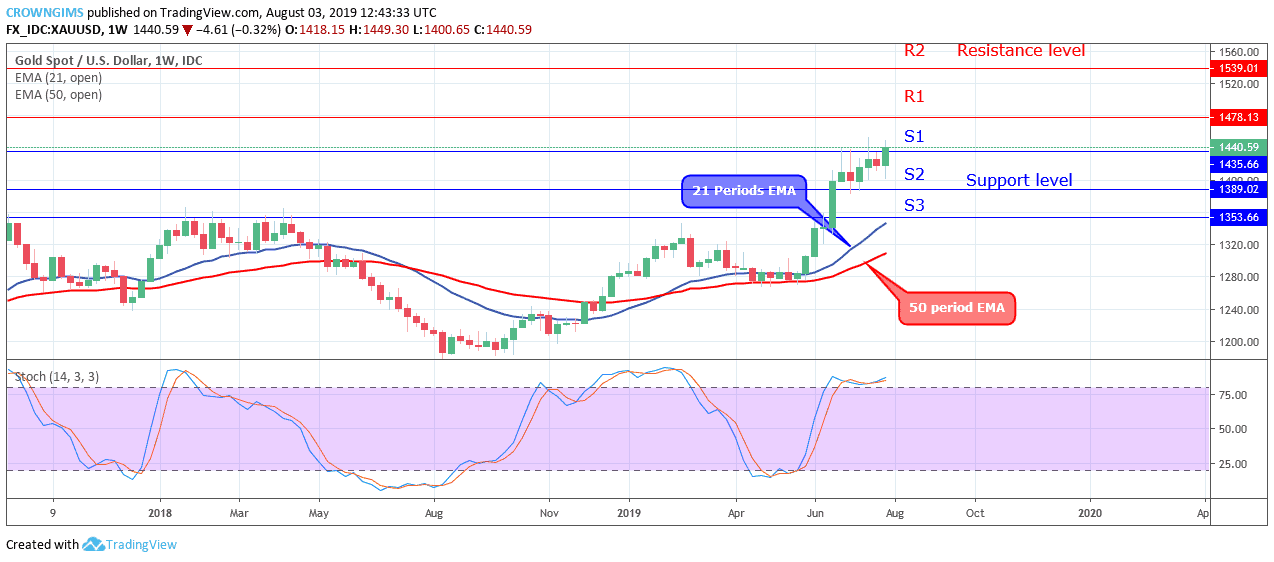
Platinum price is directly trading on the 21 periods EMA and the 50 periods EMA is below the two. The 21 period EMA is yet to cross the 50 EMA upside, that means the bullish trend is not yet established. However, the stochastic Oscillator period 14 is at 40 levels with the signal line pointing up to indicate a buy signal. Platinum price may reach the supply level of $898 should the Bulls increase their momentum after the pullback.
XPTUSD medium-term Trend: Bearish
XPTUSD is bearish in the medium-term outlook. After the breakout of the Platinum price at $833 price level on July 15, the price was increasing towards the supply level of $898. Last week, the Bears interrupted the price increase before the $898 level was reached. The price turned and declined towards the demand level of $833.
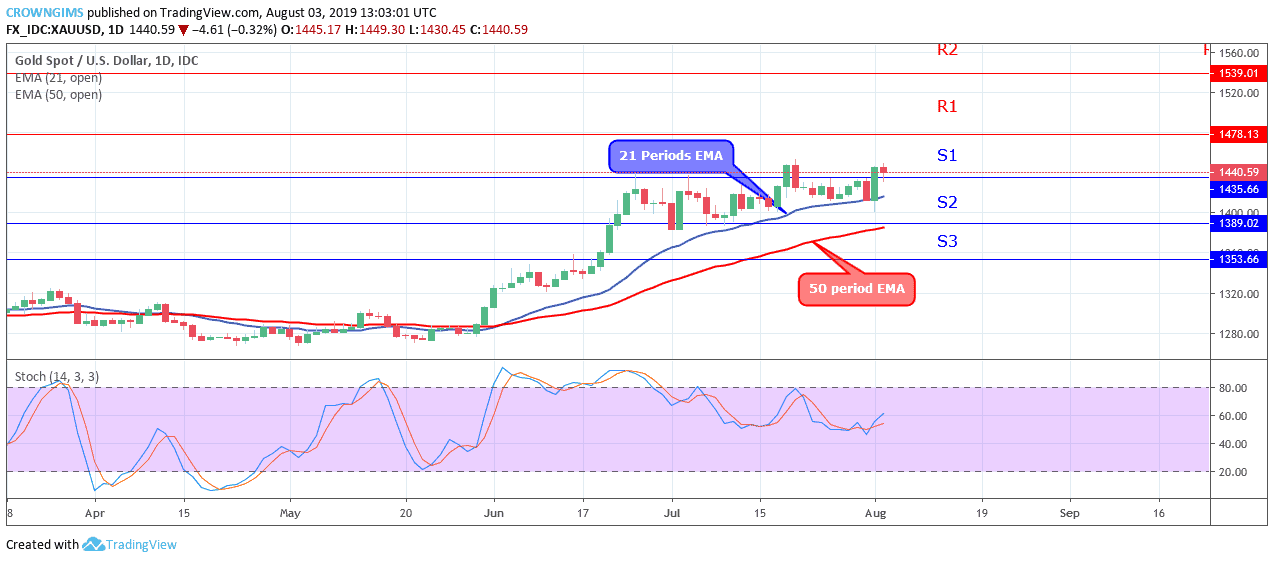
The price changed direction to the south and trading in between the 21 periods EMA and 50 periods EMA. The bullish trend may resume should the demand level of $833 holds. In case the Bears break down the demand level of $833, the price may decrease towards the demand level of $776.
The Stochastic Oscillator period 14 is at 40 levels and the signal lines pointing downside to indicate sell signal.
Please note: insidebitcoins.com is not a financial advisor. Do your research before investing your funds in any financial asset or presented product or event. We are not responsible for your investing results.
Join Our Telegram channel to stay up to date on breaking news coverage