Join Our Telegram channel to stay up to date on breaking news coverage
USDCAD Price Analysis – April 18
USDCAD started moving sideways since March 21 within the range of $1.3472 supply level and $1.3313 demand level. Should the Bears exert more pressure and break down the demand level of $1.3312, then, USDCAD will have its low at $1.3207.
USD/CAD Market
Key levels:
Supply levels: $1.3472, $1.3648, $1.3845
Demand levels: $1.3312, $1.3207, $1.3084
USDCAD Long-term trend: Ranging
USDCAD is on the sideways movement on the long-term outlook. On March 7, the USDCAD price reached a high of $1.3472. At the same supply level, a bearish reversal candle pattern formed called evening star; this reduced the USDCAD price to $1.3312 price level. The Cryptocurrency pair consolidated for five days at $1.3312. USDCAD started moving sideways since March 21 within the range of $1.3472 supply level and $1.3313 demand level.
The two EMAs are placed horizontally flat on the daily chart showing no direction; which implies that sideways movement is ongoing. USDCAD is trading over and around the 21 periods EMA and 50 periods EMA. The Relative Strength Index period 14 is at 55 levels and the signal line points up which indicate buy signal.
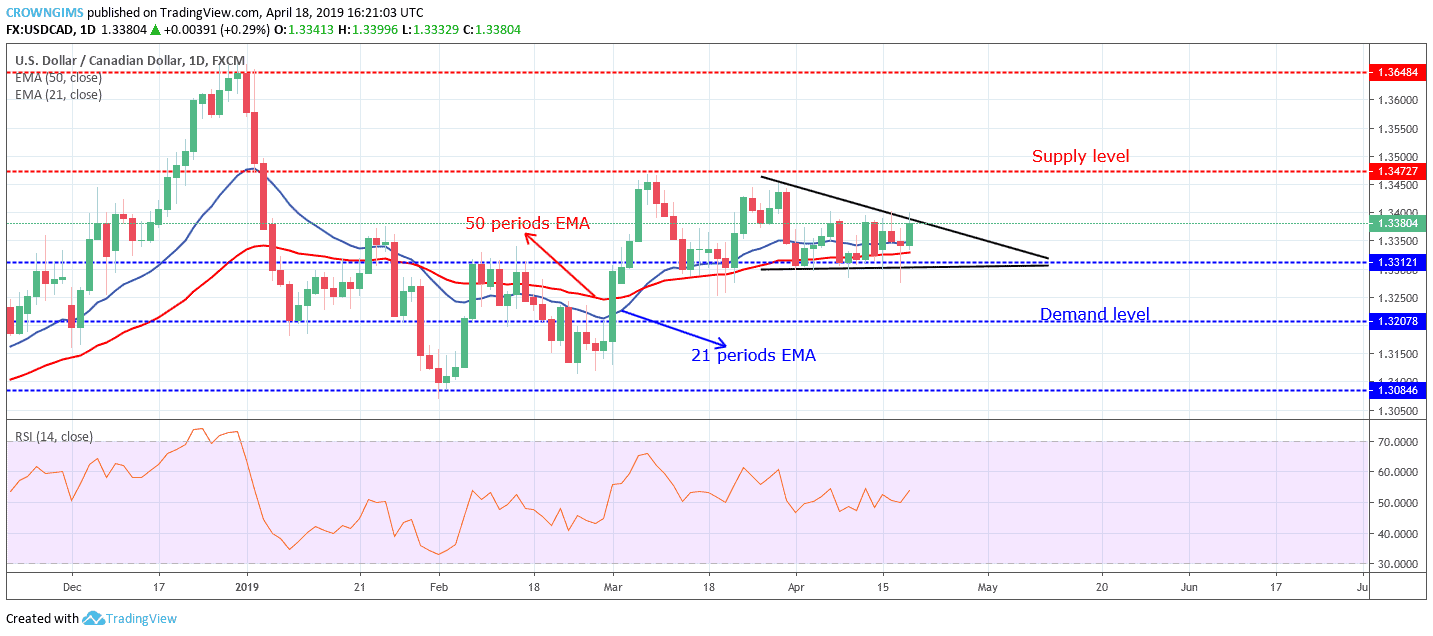
The symmetrical triangle pattern is noticed on the chart. Should the Bears exert more pressure and break down the demand level of $1.3312, then, USDCAD will have its low at $1.3207. In case the demand level of $1.3312 holds and the Bulls gain more pressure, USDCAD will resume bullish trend.
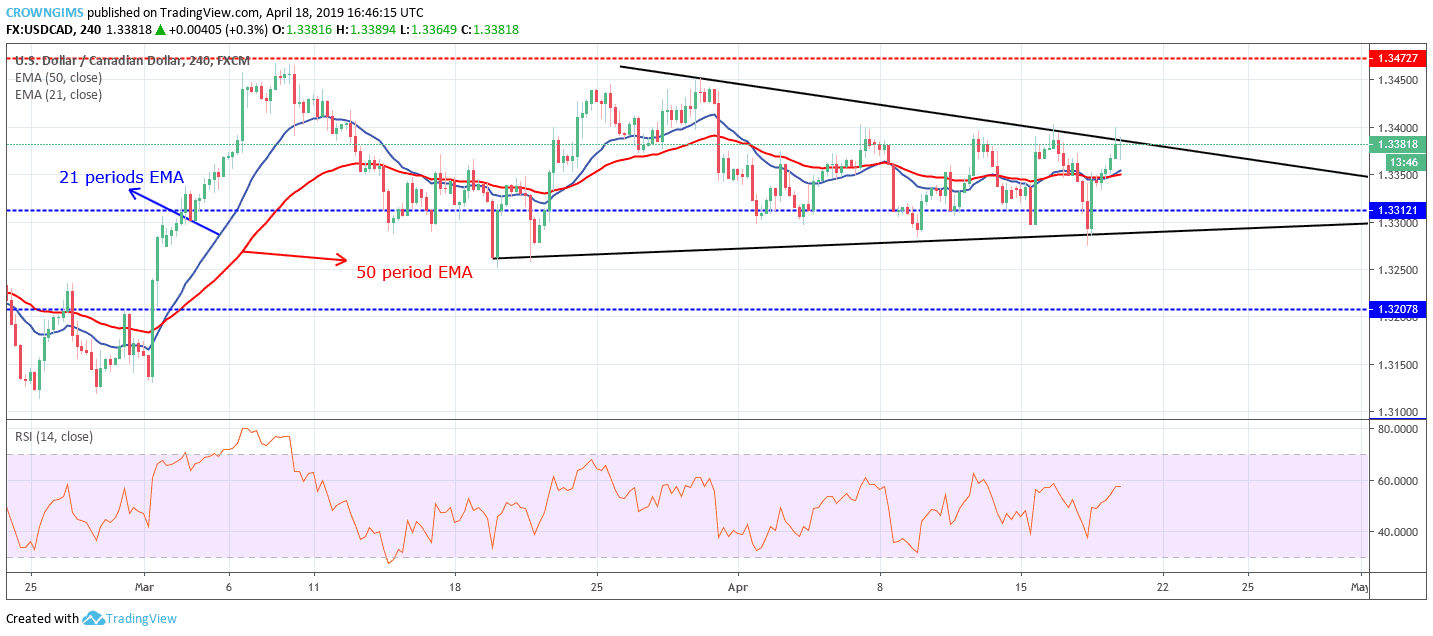
USDCAD medium-term Trend: Ranging
USDCAD is on the sideways movement on the medium-term outlook. The Bears and the Bulls have been operating at equilibrium in terms of momentum. That is why the currency pair has not made a significant movement on the 4-hour chart. The sideways movement of the currency pair formed a symmetrical triangle. USDCAD is bouncing back as it is touching both the upper and lower trend line of the triangle.

Meanwhile, the Relative Strength Index period 14 is at 60 levels pointing down to indicate a sell signal.
Please note: insidebitcoins.com is not a financial advisor. Do your own research before investing your funds in any financial asset or presented product or event. We are not responsible for your investing results.
Join Our Telegram channel to stay up to date on breaking news coverage