Join Our Telegram channel to stay up to date on breaking news coverage
The Tron price prediction may need to stage a meaningful short-term rally for the coin to see a rise above the $0.070 level.
Tron Prediction Statistics Data:
- Tron price now – $0.066
- Tron market cap – $6 billion
- Tron circulating supply – 90.7 billion
- Tron total supply – 90.7 billion
- Tron Coinmarketcap ranking – #16
TRX/USD Market
Key Levels:
Resistance levels: $0.080, $0.085, $0.090
Support levels: $0.055, $0.050, $0.045
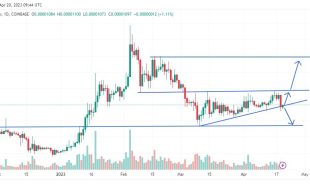
TRX/USD is seen moving in a narrow trading range after a bullish rally failed to materialize. The early daily rally towards the $0.070 level failed to generate sustainable gains, with TRX/USD slowly climbing above the 9-day and 21-day moving averages. However, the longer that the Tron price fails to rally from current trading levels, the greater the chance that we may see the coin falling to a new monthly trading low.
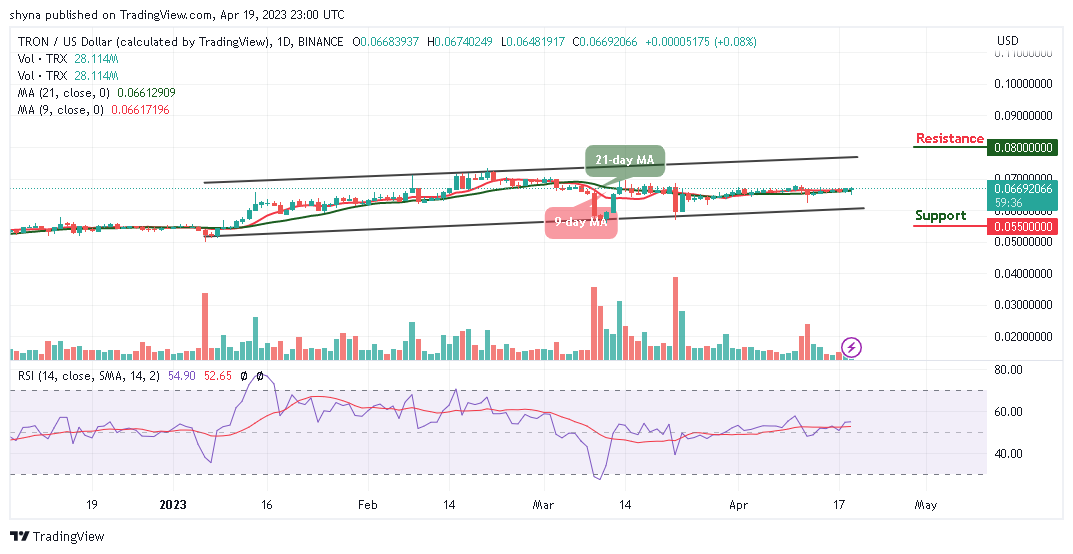
Tron Price Prediction: Tron (TRX) May Head to the Upside
The Tron price is likely to stay above the 9-day moving average, but the longer the coin fails to rally from current trading levels, the greater the chance that traders may see the coin falling. A break toward the lower boundary of the channel could touch the support levels of $0.055, $0.050, and $0.045. The technical indicator Relative Strength Index (14) is moving above the 50-level, suggesting a sideways movement for the market.
Nonetheless, the daily chart highlights that TRX/USD bulls need to re-group and energized the market by pushing the price toward the upper boundary of the channel. However, any further bullish movements above this barrier could locate the resistance levels of $0.080, $0.085, and $0.090.
Against Bitcoin, the Tron (TRX) price is moving to cross above the 9-day and 21-day moving averages. The coin may begin to follow the upward movement if it crosses above the nearest resistance level of 250 SAT.
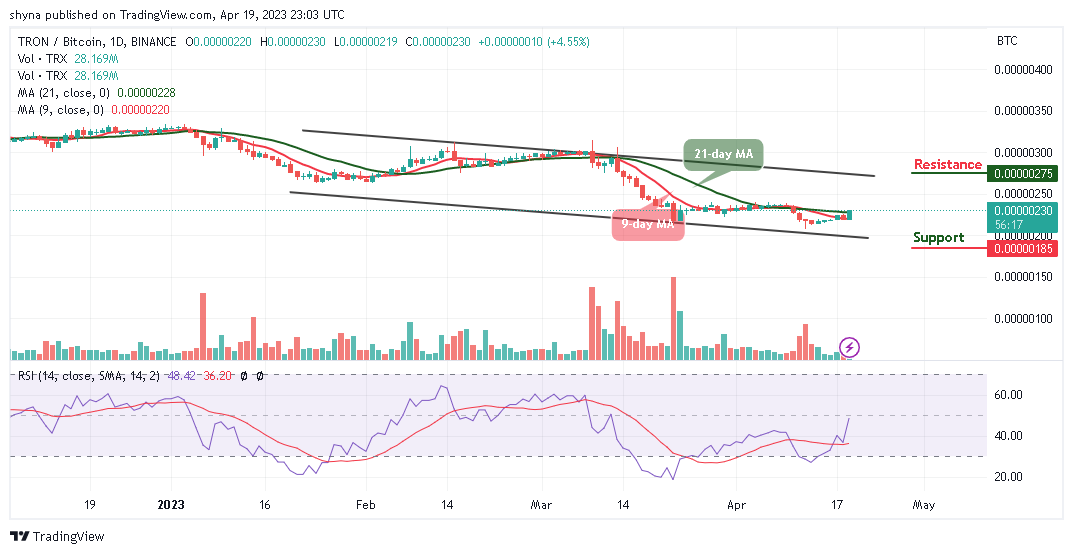
However, as the technical indicator, Relative Strength Index (14) implies, the signal line is likely to cross above 50-level with a possible break above the 9-day and 21-day moving averages. Meanwhile, any further bullish movement could lead to a resistance level of 275 SAT and above. On the contrary, falling below the lower boundary of the channel may touch the support level of 185 SAT and below.
Tron Alternatives
The Tron price is trading at $0.066 after adding 0.08% to its value on the day. Meanwhile, the strength of the coin is opening the door for a massive recovery movement targeting $0.070. From a technical perspective, TRX/USD is capable of tackling the hurdles towards the upside as the Relative Strength Index (14) may move to cross above the 60-level. However, Love Hate Inu is creating a safe space for people to share their opinions with other people who care what they think, and who don’t criticize them for having that opinion. Moreover, in the ongoing presale, LHINU token has raised more than $5 million already and is burning through presale stages.
Join Our Telegram channel to stay up to date on breaking news coverage