Join Our Telegram channel to stay up to date on breaking news coverage
Tron (TRX) Price Analysis – September 4
TRX is one of the profit-giving altcoins. But at present, it seems to have turned cold as it is trading in the said price range, though with a bearish crossover.
TRX/USD Market
Key Levels:
Resistance levels: $0.018, $0.020, 0.022
Support levels: $0.013, $0.011, $0.009
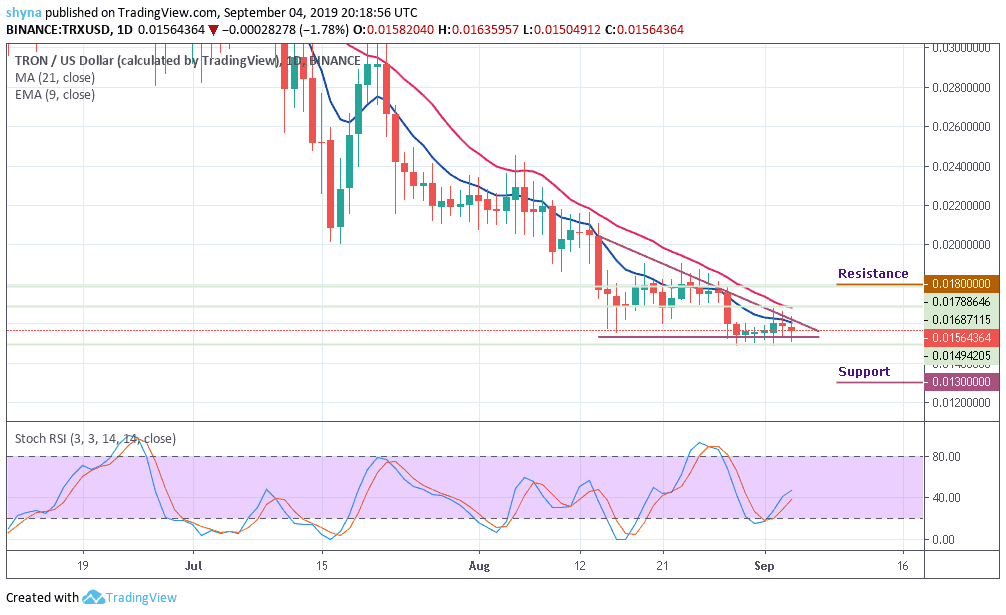
Tron price is still trading with solid selling pressure and has no support from the long-term moving averages. For quite some time now, Tron price continues to trade between $0.014 and $0.018. TRX in last week’s dip traded around $0.014 and $0.016 to a major extent but did not go below $0.014.
Furthermore, Tron trading price range is well supported by the short-term moving averages of 9-day and 21-day. If the coin continues to remain under the control of the bear, the price may get to the nearest supports at $0.013, $0.011 and $0.009 levels. It is important to note that the TRX market remains on a short-term downtrend.
Meanwhile, a bullish control could bring the price to the critical resistance at $0.018. Peradventure the buyers overcome this level, resistances of $0.022 and $0.024 may come into play in the long run. The stochastic RSI faces upward, suggesting a rise in the price of TRX.
TRX/BTC Market
Comparing with Bitcoin, Tron (TRX) is still trading on the downside, although the price action has remained intact within the descending channel. If selling pressure persists, the TRX price variation may likely create another new low in the coming days. For now, the RSI (14) has crossed to the oversold and we may continue to see a negative move in the market.
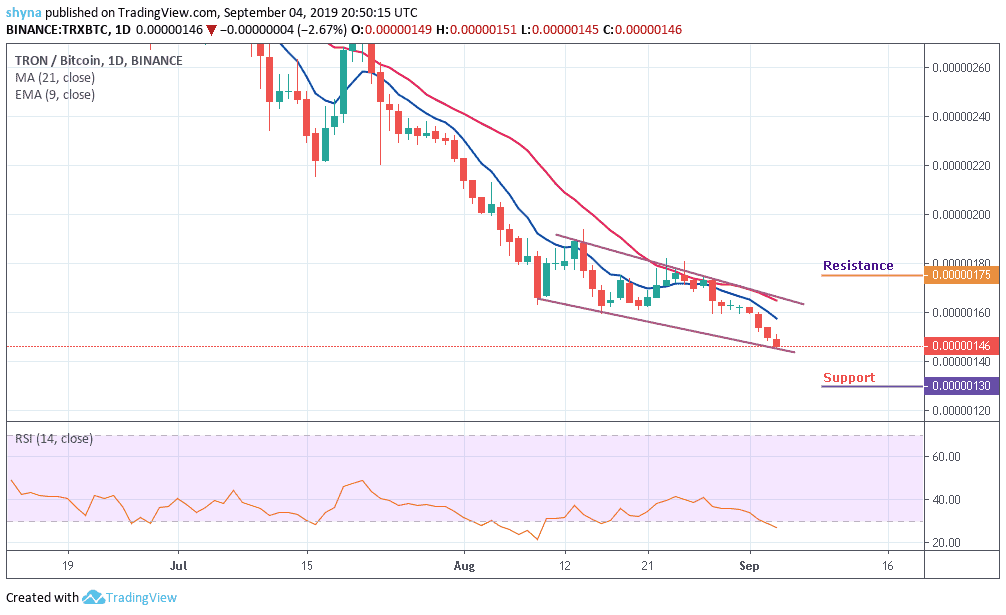
Similarly, the coin is currently trading below the 9-day EMA and 21-day MA at 146SAT. We can expect close support at the 130SAT before breaking to 120SAT and potentially 110SAT levels. If a bullish move occurs and validates a break significantly above the channel; we can then confirm a bull-run for the market and the closest resistance levels lie at 175SAT, 185SAT, and 195SAT.
Please note: Insidebitcoins.com is not a financial advisor. Do your research before investing your funds in any financial asset or presented product or event. We are not responsible for your investing results.
Join Our Telegram channel to stay up to date on breaking news coverage