Join Our Telegram channel to stay up to date on breaking news coverage
The Graph price prediction shows that GRT could set a bullish run if the market can keep the coin above the resistance level of $0.12.
The Graph Prediction Statistics Data:
- The Graph price now – $0.11
- The Graph market cap – is $1.0 billion
- The Graph circulating supply – 8.7 billion
- The Graph total supply – 10.5 billion
- The Graph Coinmarketcap ranking – #52
GRT/USD Market
Key Levels:
Resistance levels: $0.15, $0.17, $0.19
Support levels: $0.09, $0.07, $0.05
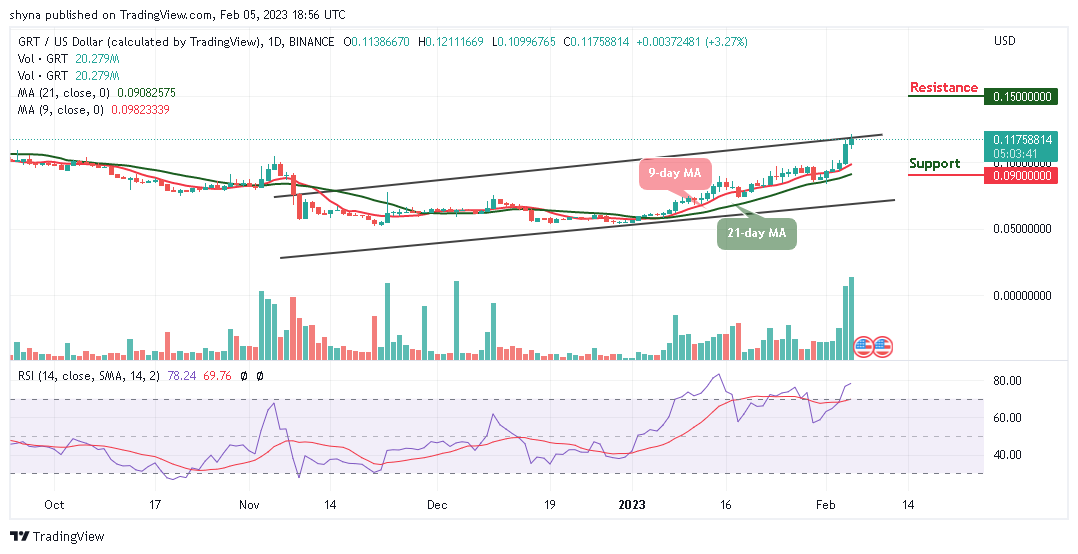
GRT/USD is running a little retracement move above $0.11 with price growth of 3.27%. For the fact that the coin is recording some gain, the Graph price may follow a bullish movement if the coin crosses above the upper boundary of the channel. Meanwhile, traders can expect the price to continue to rise if the bulls put more pressure on the market.
The Graph Price Prediction: GRT/USD May Spike Higher
The Graph price is on its way above the 9-day and 21-day moving averages at around $0.11. If the price continues to create a bullish movement, traders can then expect a bullish continuation toward the upside. Meanwhile, as the technical indicator Relative Strength Index (14) moves within the overbought region, the possible resistance levels could be found at $0.15, $0.17, and $0.19 in the long term.
However, if the coin keeps the bullish movement for the next couple of days, traders may witness more of it reach higher levels. Meanwhile, the Graph price is trying to create a bullish movement in the short term. On the contrary, any bearish movement below the moving averages could roll the coin back to the long-term support at $0.09, $0.07, and $0.05 levels.
Against Bitcoin, the Graph price is likely to cross above the upper boundary of the channel if the buyers keep the coin above the 9-day and 21-day moving averages. With the look of things, there is a need for an increasing volume and resistance to cause an upsurge in the market. At the moment, The Graph (GRT) is trading around the 510 SAT. On the contrary, traders can expect close support at 400 SAT and below.
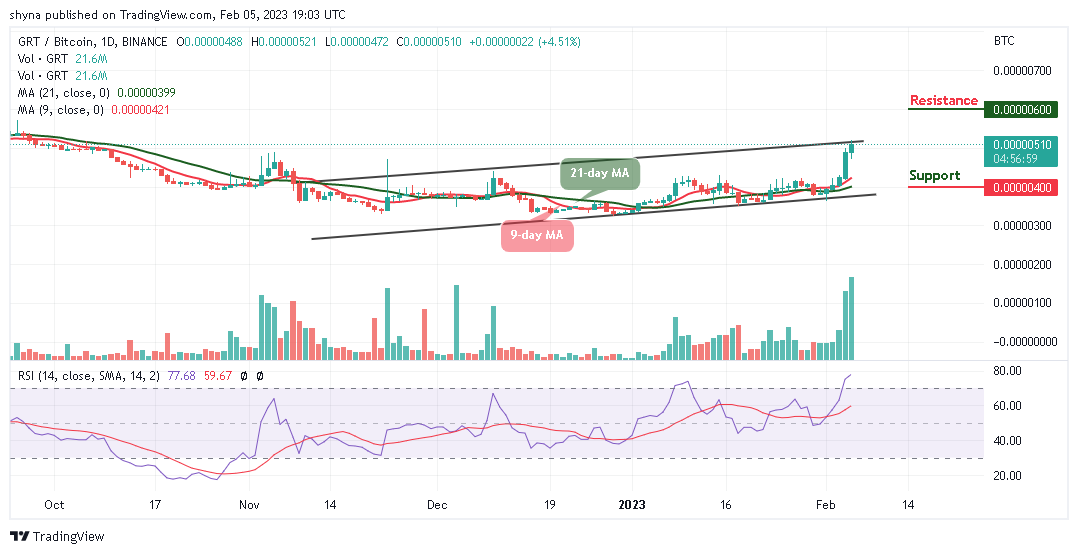
However, if a bullish move pushes the price above the upper boundary of the channel, the channel; traders can then confirm a bull run for the coin. Moreover, the closest resistance could be located at 600 SAT and above as the technical indicator Relative Strength Index (14) moves above the 70-level, suggesting bullish movement.
The Graph Alternatives
The Graph is currently moving upwards steadily, currently trading at $0.11, and up nearly 3.27% in the last six days. It is currently sitting above its $0.10 support as the consolidation of this support is expected to help the coin reach $0.15 or higher. On that note, the Meta Masters Guild presale is still selling very fast, and it has now raised $2.7m for the future development of the token. However, if the presale continues to sell MEMAG at this rate, it will be sold out well ahead of the last day– so investors should move quickly before it’s too late.
Join Our Telegram channel to stay up to date on breaking news coverage