
Join Our Telegram channel to stay up to date on breaking news coverage
The Tezos price prediction shows that XTZ is currently pushing higher with 9.04% gains as the coin manages to face the north.
Tezos Prediction Statistics Data:
- Tezos price now – $1.33
- Tezos market cap – $1.1 billion
- Tezos circulating supply – 928 million
- Tezos total supply – 949 million
- Tezos Coinmarketcap ranking – #45
XTZ/USD Market
Key Levels:
Resistance levels: $1.60, $1.70, $1.80
Support levels: $1.00, $0.90, $0.80
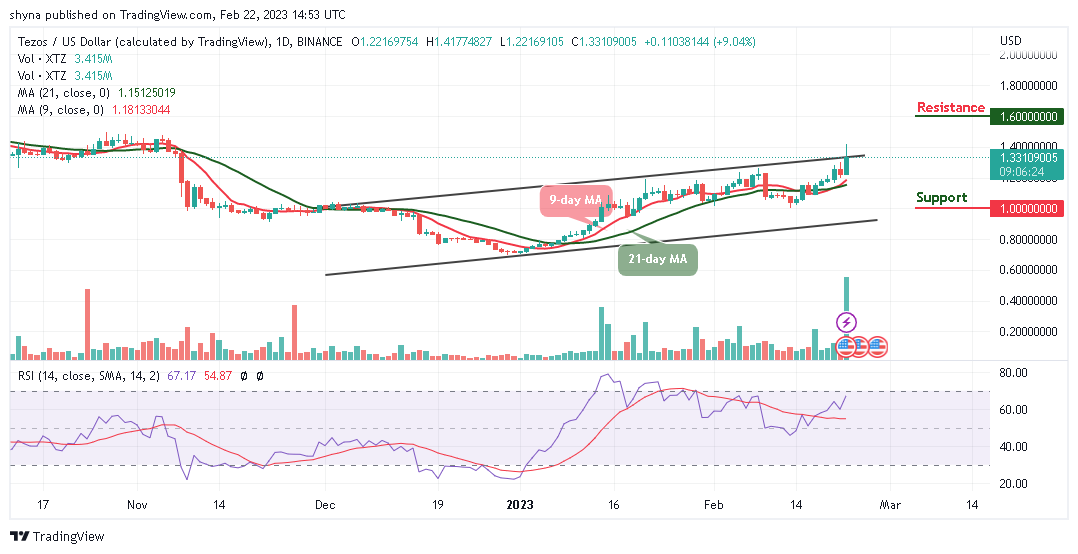
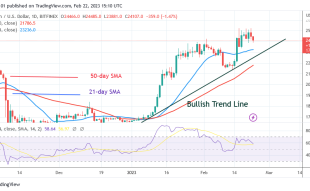
Looking at the daily chart, XTZ/USD manages to reach a daily high of $1.41 as the market opens today. During the European session, the Tezos price moves to cross above the upper boundary of the channel. Meanwhile, the push to the upside allows the Tezos price to climb back to the positive side. This bounce above the 9-day and 21-day moving averages shows that buyers are likely to dominate the market.
Tezos Price Prediction: Tezos Price May Be Ready for the Upside
At the time of writing, the Tezos price may continue to follow the uptrend if the bulls increase the buying pressure. However, if XTZ/USD needs to see a shift in momentum, the bulls may need to push the price above the channel as the nearest resistance level could be established around the resistance level of $1.40. Therefore, a bullish breakout above the barrier could take XTZ to the potential resistance levels of $1.60, $1.70, and $1.80 as the technical indicator Relative Strength Index (14) moves to cross into the overbought region.
Nevertheless, XTZ/USD is likely to create additional gains as all the technical indicators confirm the upward movement. In other words, if the market dives below the moving averages, a bearish movement towards the lower boundary of the channel may cause the Tezos price to revisit the downside which could hit the support levels at $1.00, $0.90, and $0.80 respectively.
Against Bitcoin, Tezos (XTZ) continues to demonstrate some positive signs across the market and the coin is likely to maintain the bullish movement in the long term, moving within the channel could take the coin to higher levels. Meanwhile, XTZ/BTC is currently changing hands at 5470 SAT which is above the 9-day and 21-day moving averages.
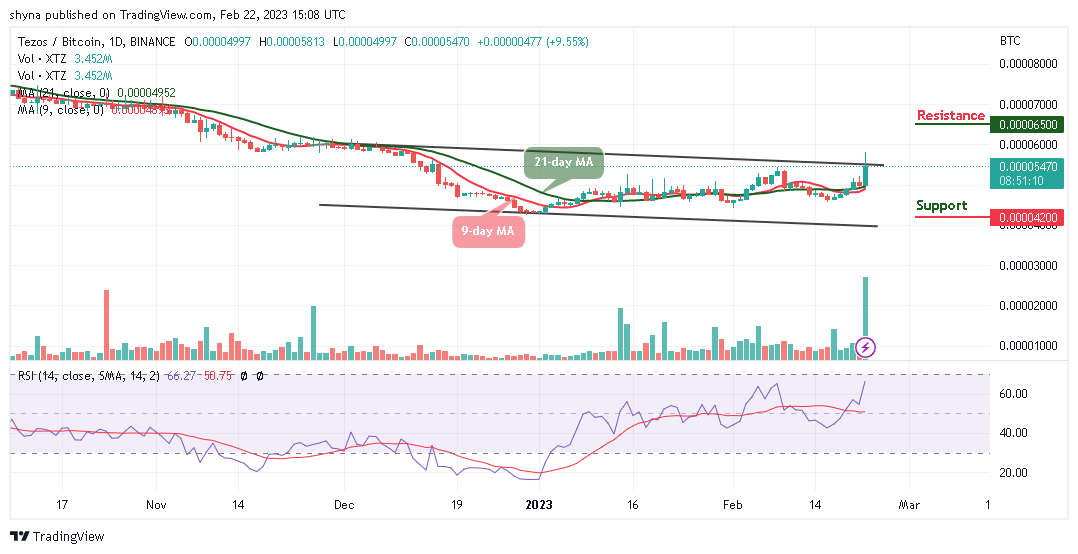
However, the resistance level could be located around 6500 SAT and above but any bearish movement below the moving averages may bring the coin to the closest support level at 4200 SAT and below. Meanwhile, the technical indicator Relative Strength Index (14) is moving to cross above the 70-level, suggesting a bullish movement for the market.
Tezos Alternatives
The daily chart showcases the Tezos price is getting set for swing highs around the upper boundary of the channel. However, the Tezos (XTZ) market buyers are to exercise caution by avoiding opening a buying order when the market tends to result in a correction below the moving averages. Meanwhile, it is important to know that the Fight Out token is still very hot at the moment. Investors are encouraged not to miss this opportunity for any reason as the presale is still live, and close to $5 million has been realized so far.
Join Our Telegram channel to stay up to date on breaking news coverage