Join Our Telegram channel to stay up to date on breaking news coverage
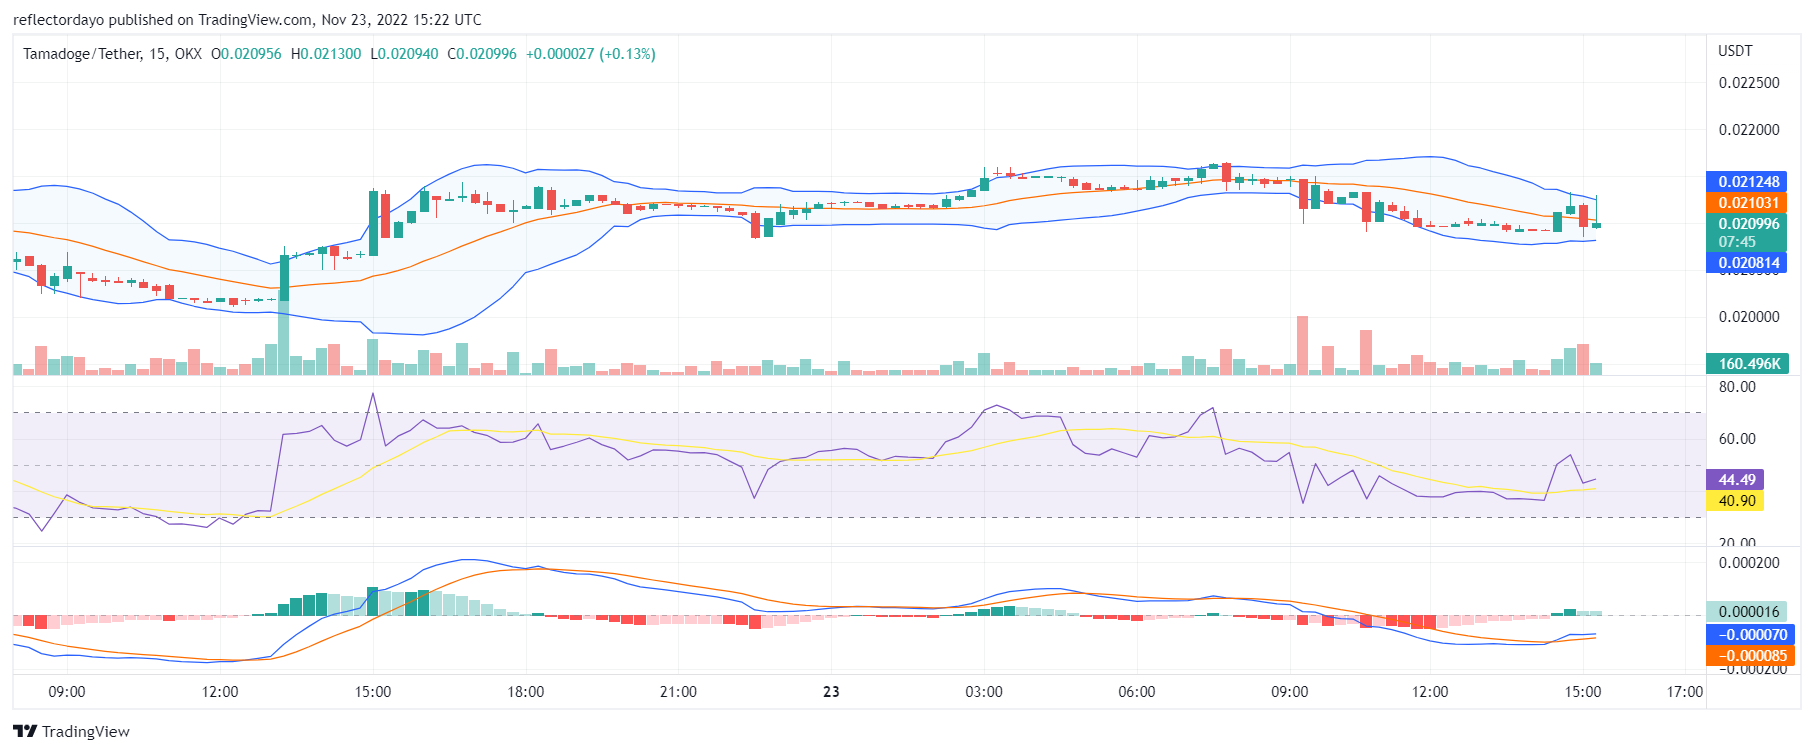
As Tamadoge Bulls succumb to the bearish resistance at the $0.0215 price level, they lose their grip on the market, and the price dropped to $0.0209. From here, they secured strong support that changes the bearish move to a very flat market sideway-ranging market. The buying pressure was able to advance the price above the 20-day moving average in the 14th hour and also break the price away from the deadlock.
Tamadoge Market Price Statistic:
- TAMA/USD price now: $0.0213
- TAMA/USD market cap: $32,889,481
- TAMA/USD circulating supply:1.05Billion
- TAMA/USD total supply: 1,049,733,333
- TAMA/USD coin market ranking: #2715
Key Levels
- Resistance: $0.0255, $0.0260, $0.0270,
- Support: $0.0200, $0.0180, $0.0170
Tamadoge Market Price Analysis: The Indicators’ Point of View
After the price action came up above the 20-day moving average, we discover a resistance forming at the $0.0212 price level. But the bulls seem to have established their ground above the 20-day moving average while the struggle between them and the bears continues at the resistance level. The direction of the Bollinger band is facing a downward direction, but as the bands are now contracting, the market may be preparing for another price break out that will change the direction of the market to the upside.
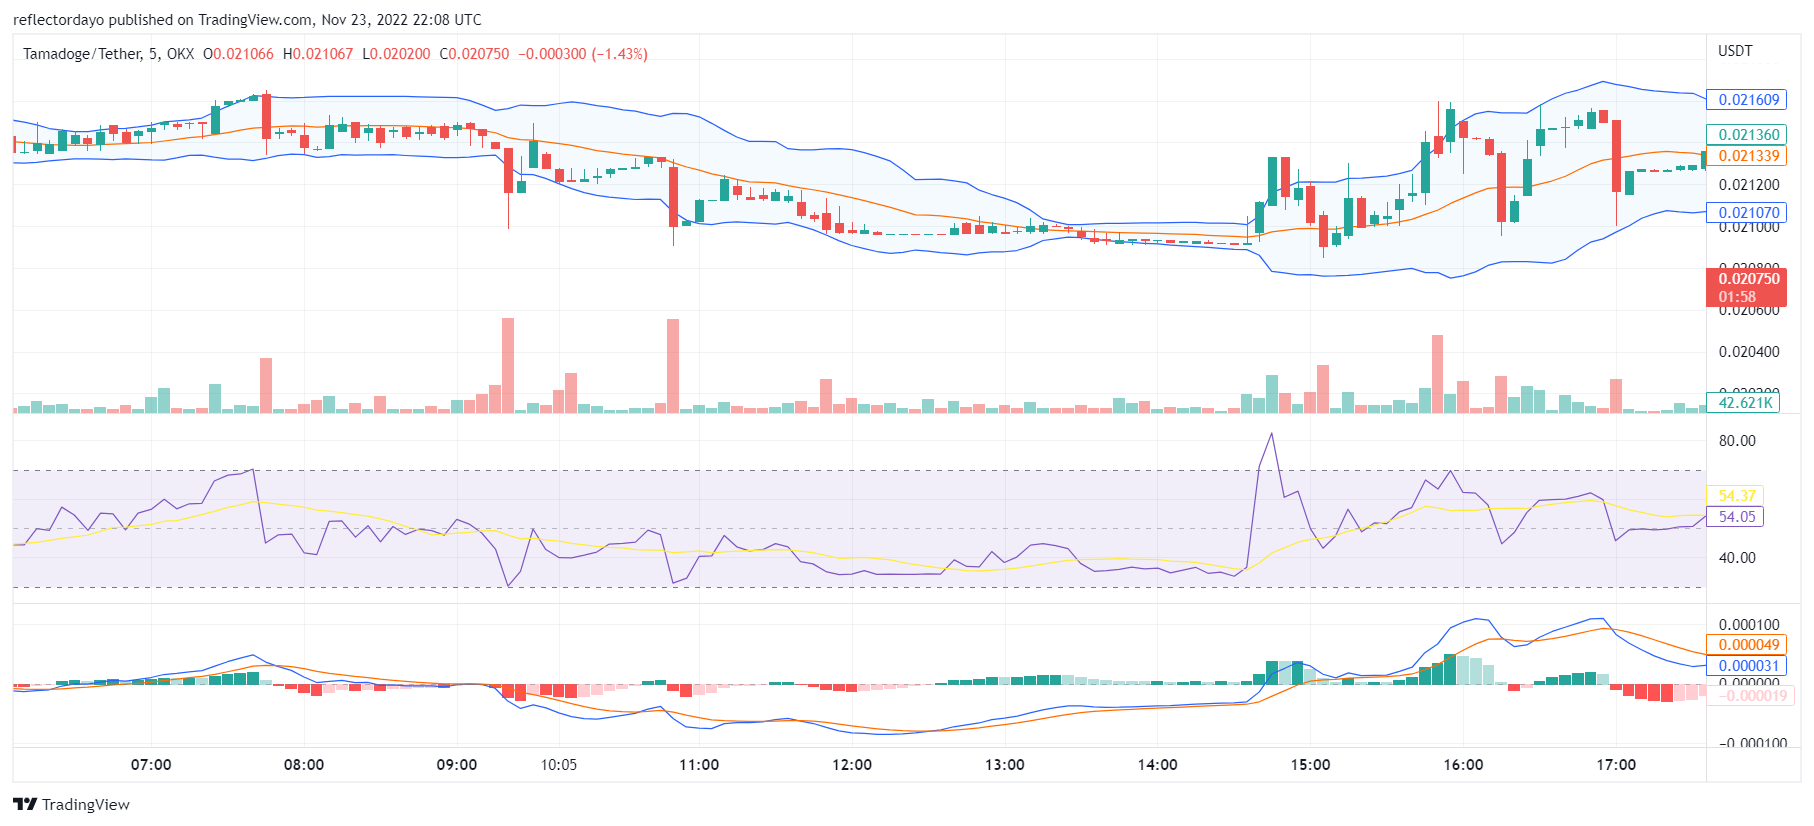
Tamadoge: TAMA/USD 5-Minute Chart Outlook
This smaller timeframe reveals that Tamadoge is becoming active as the volume of trade begins to see a few spikes along the line. The upper and lower band of the Bollinger indicator reacts to these changes in the market. The upper band of the indicator and the moving average of the indicator follows the upward direction of the price action, but the lower band seems to be moving in a downward direction. For now, more traders are buying, so the next stop for the price should be $0.023
We’re all in the same boat ?#TamadogeArmy #Tamadoge #Memecoin pic.twitter.com/Lf5Y9hilA9
— TAMADOGE (@Tamadogecoin) November 23, 2022
Related
Join Our Telegram channel to stay up to date on breaking news coverage