Join Our Telegram channel to stay up to date on breaking news coverage

The Synthex market formed a support price in yesterday’s trading session at $2.303 and used this to perform in a bullish way. The bulls market of yesterday crossed up above the $2.400 price level and continued the bullish move in today’s trading session. The general bullish trend of this crypto started on the 16th of October, but the bullish price for the two days that followed reduced due to increase in selling pressure. On the 19th of October, the bearish trend began. Eventually, the market settled on $2.200 support. The market then ranged sideways at this price level. Buyers became strong enough in yesterday’s market to break away from the 4-day tug-of-war and they continue their move in today’s market.
Synthex Market Price Statistic:
- SNX/USD price now: $2.450
- SNX/USD market cap: $728,293,515
- SNX/USD circulating supply: 302,800,380.14
- SNX/USD total supply: 303,524,288
- SNX/USD coin market ranking: #62
Key Levels
- Resistance: $2.500, $2.600, $2.700
- Support: $2.200, $2.100, $2.000
Synthex Market Price Analysis: The Indicators’ Point of View
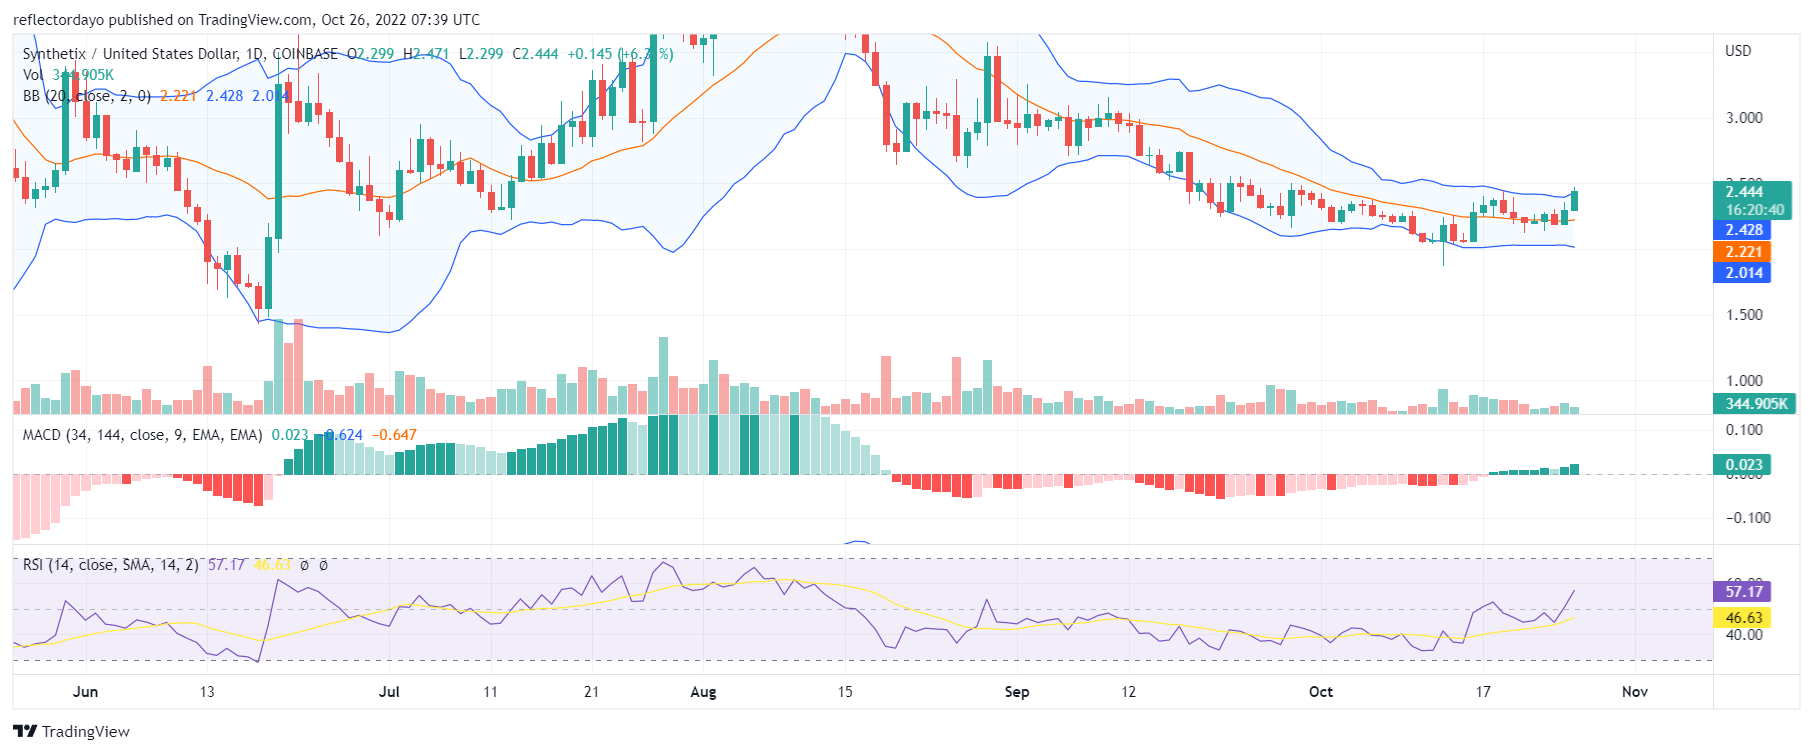
After a bearish doji appeared on the 15th of October, a very significant bullish engulfing candle pattern followed it (the next day) on the 16th of October. This gives speculators enough evidence that a bullish trend is imminent. The doji of the 15th of October (also) followed a very bearish candle on the 14th of October. This means that the selling pressure is becoming weaker while the buying pressure is becoming stronger. After the bullish market of the 16th, the buying pressure (on the days that followed) also weakens progressively on the 17th and 18th and this resulted in a price pullback from the 19th to the 21st of October. After this, the market formed a new higher support at the $2.200 level. The RSI line has been able to retrace new direction into the bullish market zone of the indicator as the RSI line now measures 57%
SNX/USD 4-Hour Chart Outlook
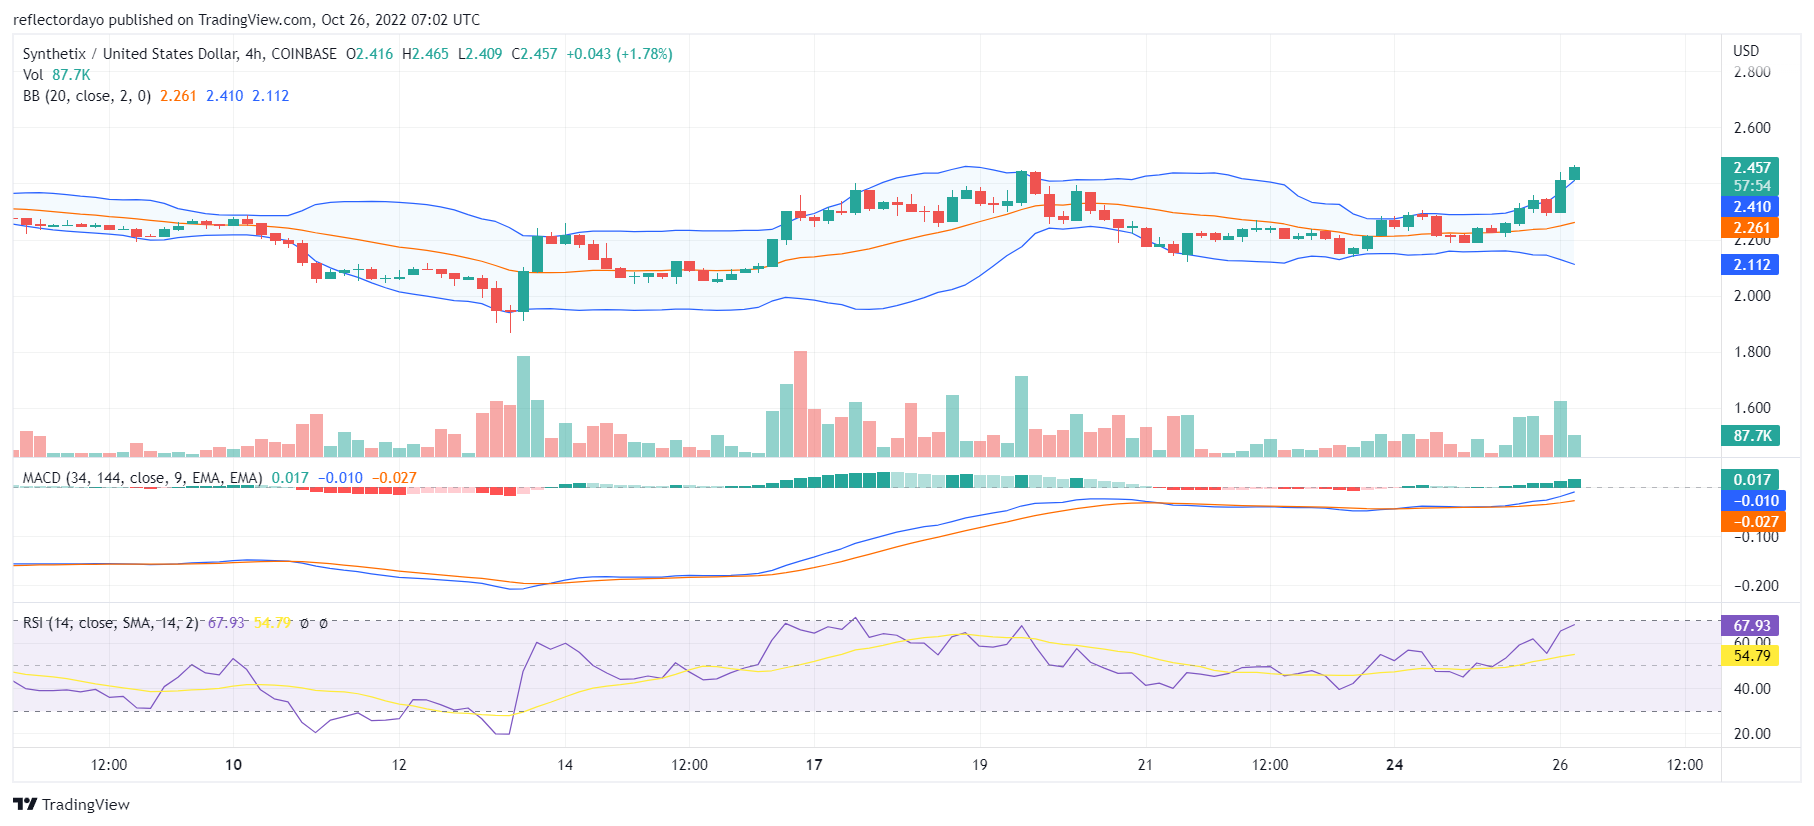
The price actions in today’s market performs above the upper band of the Bollinger indicator giving the impression of a market in overbought territory. But the bullish trend is very likely to continue as the upper band is responding and trying to catch up with the price action. The bullish MACD histograms are progressive and the MACD line is almost catching up with them to further confirm the bull’s market. The Synthex market is very likely to continue trending upward.
The Dash 2 Trade presale is off to an excellent start, having already raised more than $2 million in just a few days. The cost was only $0.0476 at the beginning, and it is currently $0.05. The price will again increase to 0.0513 at the third presale phase.
Related
Join Our Telegram channel to stay up to date on breaking news coverage


