
Join Our Telegram channel to stay up to date on breaking news coverage
The Synthetix price prediction shows that SNX could begin a steady increase if the coin crosses above the 9-day moving average.
Synthetix Prediction Statistics Data:
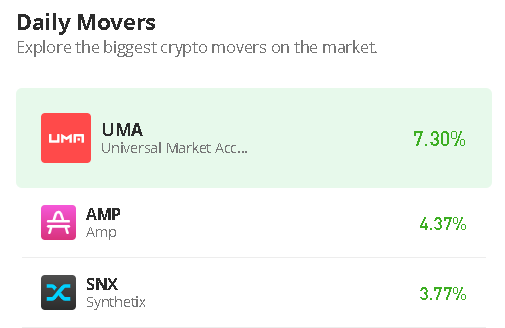
- Synthetix price now – $2.42
- Synthetix market cap – $630.2 million
- Synthetix circulating supply – 258.8 million
- Synthetix total supply – 317 million
- Synthetix Coinmarketcap ranking – #72
SNX/USD Market
Key levels:
Resistance Levels: $3.00, $3.20, $3.40
Support Levels: $1.80, $1.60, $1.40
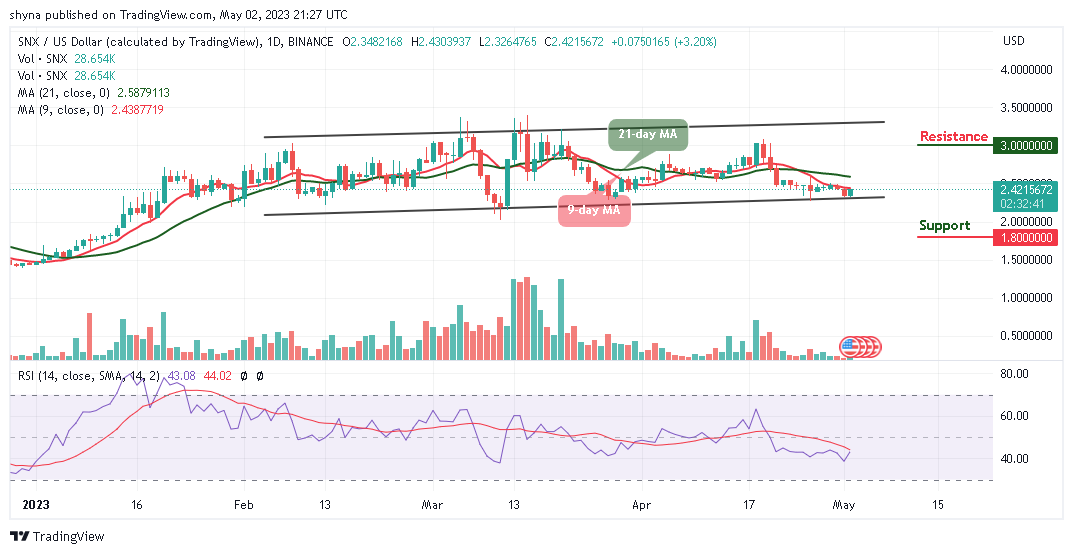
SNX/USD is facing the upside as the price hits the resistance level of $2.43. Meanwhile, a daily close above the 21-day moving average may push the Synthetix price to the resistance level of $3.00 if the bulls increase the pressure. However, traders should note that a consistent price increase may bring more buyers into the market as bulls increase their positions.
Synthetix Price Prediction: Synthetix Price Begins the Upward Movement
Looking at the daily chart, if the Synthetix price crosses above the 9-day and 21-day moving averages, it is likely to break toward the upper boundary of the channel. On that note, the daily chart also reveals that if the 9-day moving average crosses above the 21-day moving average, this could confirm the presence of bulls in the market.
However, if the bulls failed to push the coin to the upside, the bears may take advantage and bring the market price below the lower boundary of the channel. Nevertheless, the technical indicator Relative Strength Index (14) may cross above the 50-level, if the coin touches the resistance level of $2.80, it could locate the potential resistance levels at $3.00, $3.20, and $3.40, but any bearish slide below the lower boundary of the channel could bring the price to the supports at $1.80, $1.60, and $1.40.
When compares with Bitcoin, the Synthetix price is likely to cross above the 9-day and 21-day moving averages as the intraday trading is bullish. The coin may head toward the upper boundary of the channel, which could hit the resistance level at 1100 SAT and above.
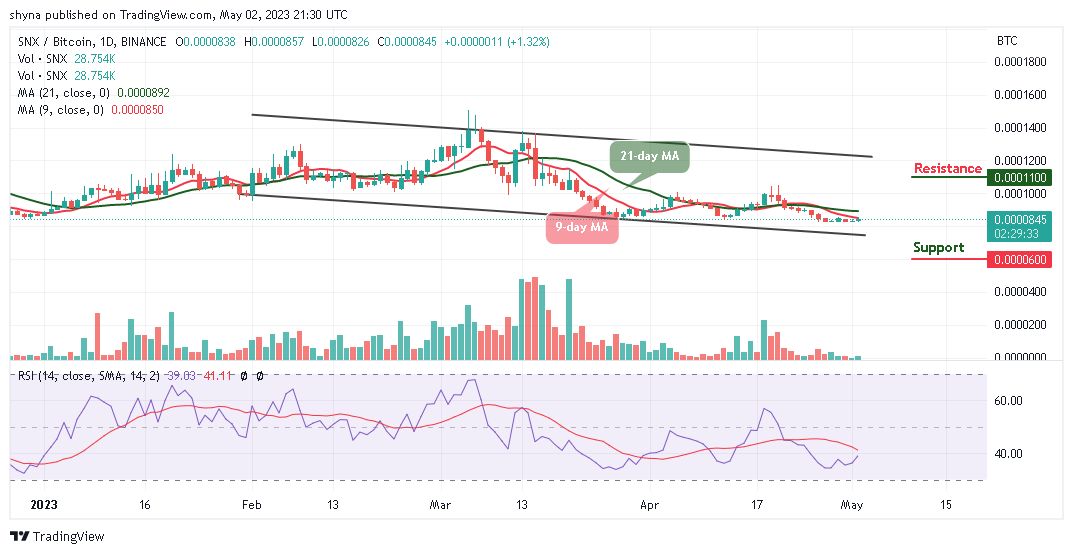
On the contrary, if the sellers bring the market to the south, traders can expect a bearish drop toward the lower boundary of the channel, breaking below this barrier may locate the support at 600 SAT and below. Meanwhile, the technical indicator Relative Strength Index (14) may cross above the 40-level to give more bullish signals in the market.
Synthetix Alternatives
The Synthetix price is facing the upside as bulls return to the market. However, if the buyers can put more effort and push the market price toward the upper boundary of the channel, the coin may create additional gains within the market. Moreover, Synthetix may exhibit the tendencies to follow an upward trend as the signal line moves toward the 50-level, suggesting that the market may head to the upside. Meanwhile, Love Hate Inu is a platform that allows you to create a recurring revenue stream from your opinions on the most hot-button issues as almost $11m has been raised so far.
Join Our Telegram channel to stay up to date on breaking news coverage