

Join Our Telegram channel to stay up to date on breaking news coverage
The Synthetix flat market trend started on the 20th of August when the market touched a support level of $2.712678, the next day 21st of August was followed by a very bullish market day. The 21st day of August did not show any sign of bearish activities. That means that full control of the market for the day was in the hand of the buyers. However, bulls could not hold on to their victory for long as selling pressure became strong enough on the following day to keep the price flat for some time. In a broad view, buying pressure and selling pressure appear to be proportionately responsive to each other (creating proportionate swings) over a while. But, from the 21st of August till today, the proportionate swings happen within a shorter period, creating a flat or ranging market. For today’s market activities, we can see that the buyers have taken the price to a high of $3.192636 before the selling pressure brings the price to $3.003200. The price consolidation may continue today.
Synthetix Market Price Statistic:
- SNX/USD price now: $3.003200
- SNX /USD market cap: $ 711,745,617
- SNX /USD circulating supply: 236,567,456.77
- SNX /USD total supply: 294,845,211
- SNX /USD coin market ranking: #58
Key Levels
- Resistance: $3.192636, $3.473991, $3.689145
- Support: $2.811979, $2.679577, $2.500000
Your capital is at risk
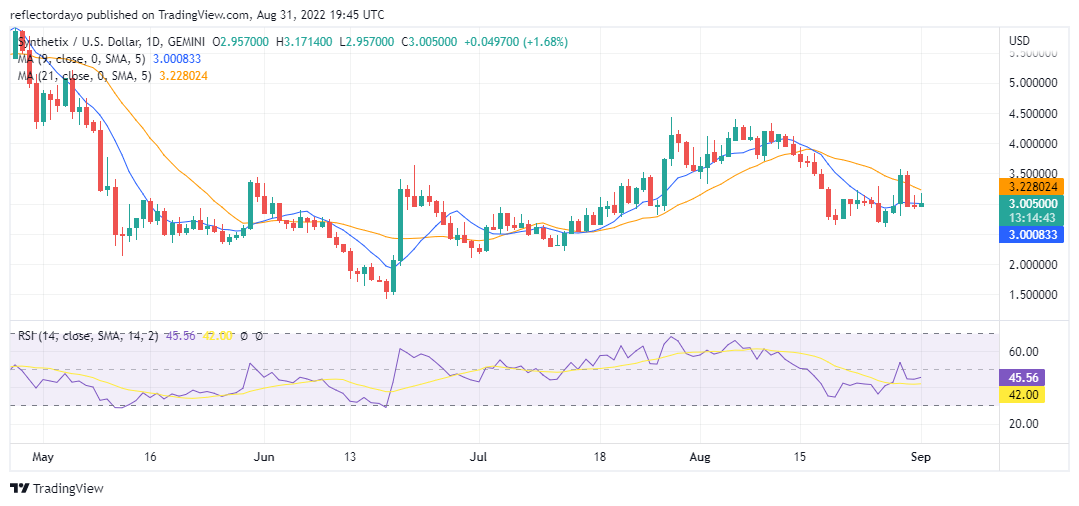
Synthetix Market Price Analysis: The Indicators Point of View
As we can see from the SNXUSD chart, the price action is below the 9-day moving average, and the 21-day moving average is above them all. The significance of the slowest moving average being above all the other indications on the chart is a downtrend market. In the Relative Strength Index, the RSI line is moving below 50%. It is precisely 45% and this shows weakness in the market. However since the bullish candlesticks still hold at the current price of $3.00, there is the probability that the price may close higher than this today.
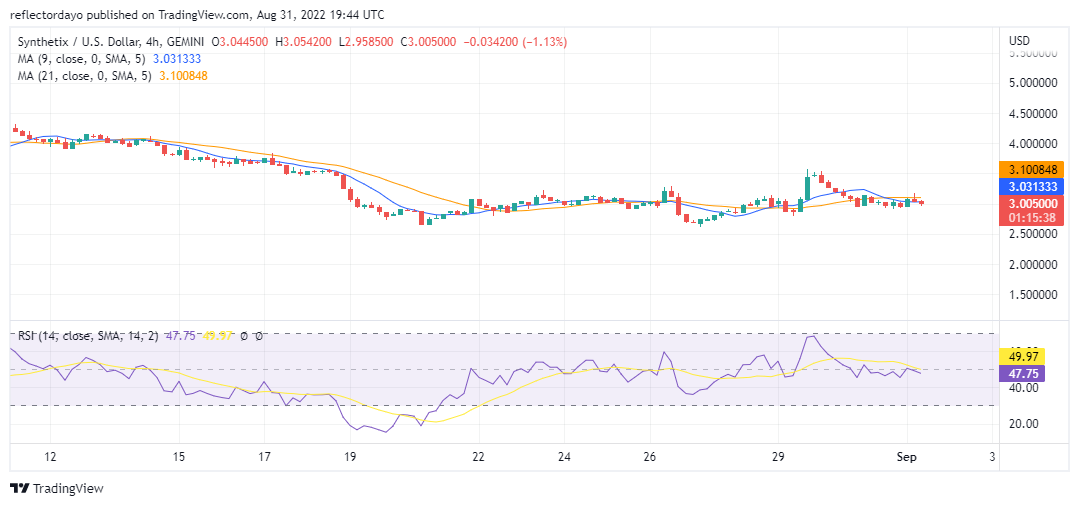
Analysis: SNX/USD 4-Hour Chart Outlook
In this timeframe, we can see that after today’s trading session opened on a bullish note, the following sessions were not characterised by bullish strength. In the second session, we can see that the sellers became stronger and they recovered their ground in the market. However, their aggressive fit does not appear as if it will last, because the momentum is reducing.
Related
Join Our Telegram channel to stay up to date on breaking news coverage
