
Join Our Telegram channel to stay up to date on breaking news coverage
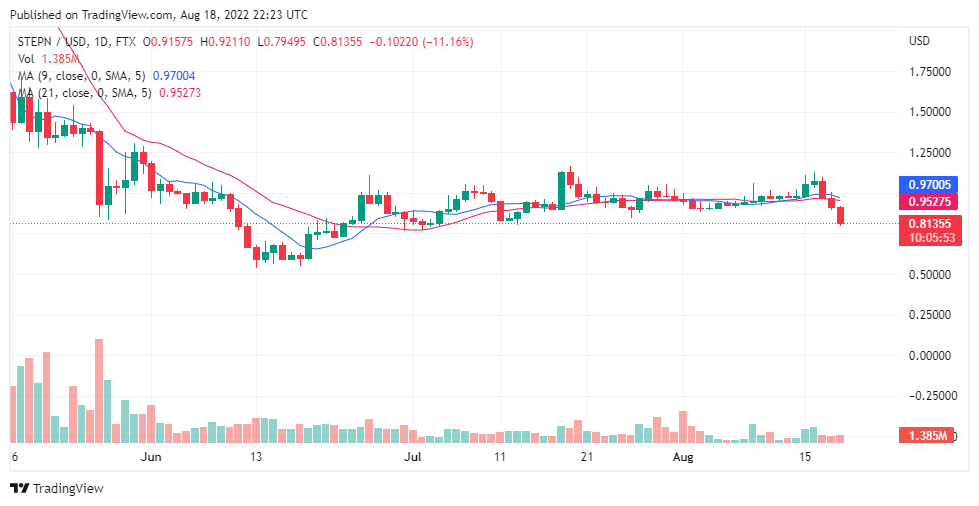
The market’s bearish activities have brought the price of GMT/USD back to the July 2nd support level of $0.80350. Since then, the buying pressure in the market is not as strong as to make the market trend up. Bullish activities against the selling pressure were only able to keep the market in a narrow range. The narrow-ranging market behaviour is well noticeable between 26th July and 14th August. From the 26th of July to 14th of August both the bulls and the bears were weak. The bulls shows more weakness as they could not hold ground against the bears. From the 17th to date we can see three consecutive bearish candlesticks.
STEPN (GMT) Price Statistic Data:
- GMT/USD price now: $0.8131
- GMT/USD market cap: $35,678,622
- GMT/USD circulating supply: 6,000,000,000 GMT
- GMT/USD total supply: 6,000,000,000 GMT
- GMT/USD coin market ranking: #78
Key Levels
- Resistance: $1.01105, $0.98765 $1.06720
- Support: $0.80890, $0.89870, $0.83785
Your capital is at risk
STEPN (GMT) Price Analysis: The Market May Fall the More
At this time, the market price is falling due to the increase in selling pressure. The bears are coming back, after some period of indecision, and they are taking control of the market. We can see how the bears took the price of STEPN (GMT) to the support level price of July 2nd. This means that traders should prepare themselves for more bearish market behaviour.
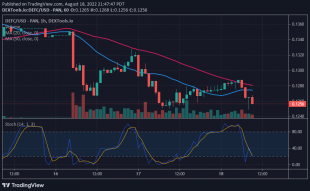
STEPN (GMT) Price Analysis: Information From the Indicators
In the chart, we can see the 9-day moving average and 21-day moving average coming almost together and going together through the price actions. The two moving averages (one fast, the other slow) comes to confirm a ranging market behaving. Yesterday 18th of August, the bears were able to break the deadlock in the market by bringing the price below the Moving averages. The RSI shows a very strong bearish market indication measuring at 36%. The RSI signal line is almost reaching the threshold of 50% as it is measuring 52%.
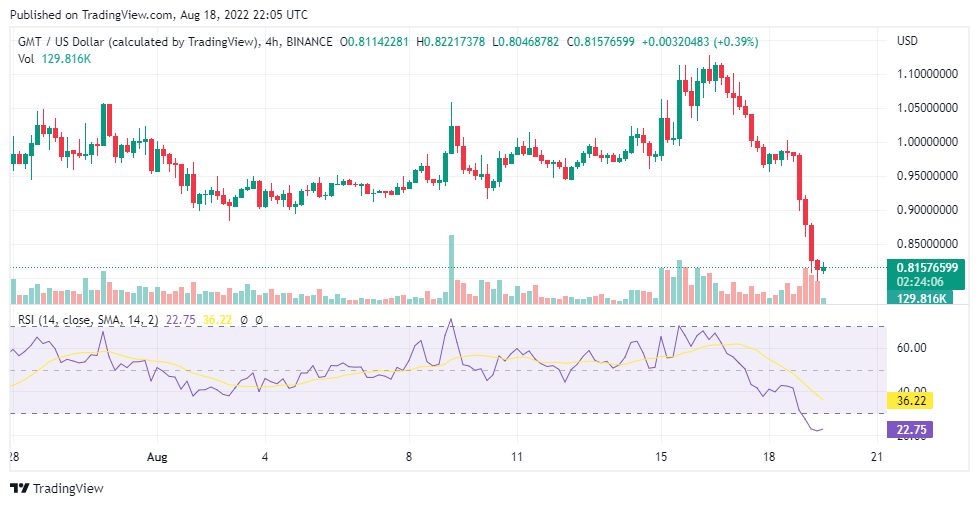
STEPN Price Analysis: GMT/USD 4-Hour Chart Point of View
Today’s bearish activities have gone too far to the oversold region of the RSI. The signal line is at 36.2% which indicates a strong downtrend. The RSI line is trying to retrace an upper position now measuring 22.7%. In agreement with the line’s retracement, we can see a small bullish candle on the chart which appear during the fourth trading session.
Related
Join Our Telegram channel to stay up to date on breaking news coverage