Join Our Telegram channel to stay up to date on breaking news coverage
Solana Price Prediction – October 22
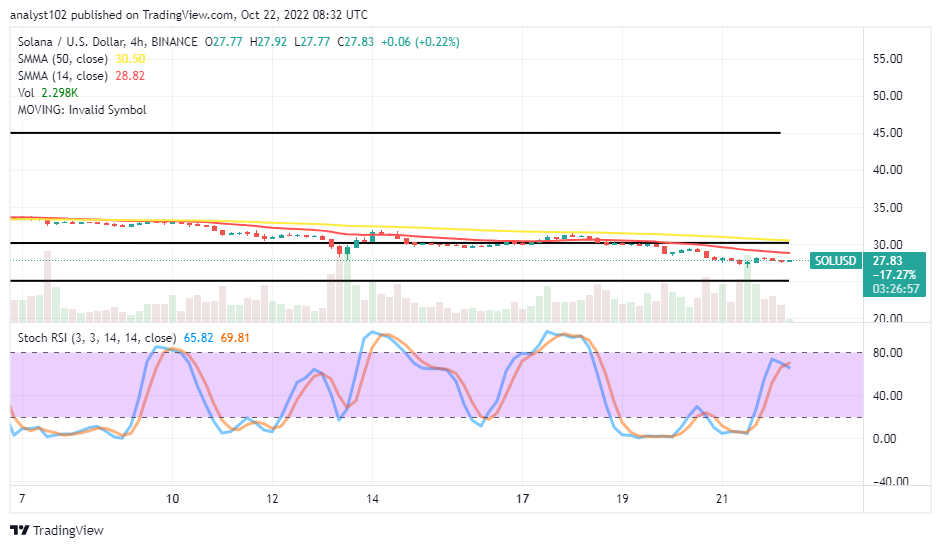
A long-holding trading situation around the $30 line has eventually degenerated into letting the SOL/USD market operation declines past the value line toward a lower zone near the $25 support line. The price is around $27.87 at an average percentage rate of 0.82.
SOL/USD Market
Key Levels:
Resistance levels: $35, $40, $45
Support levels: $25, $20, $15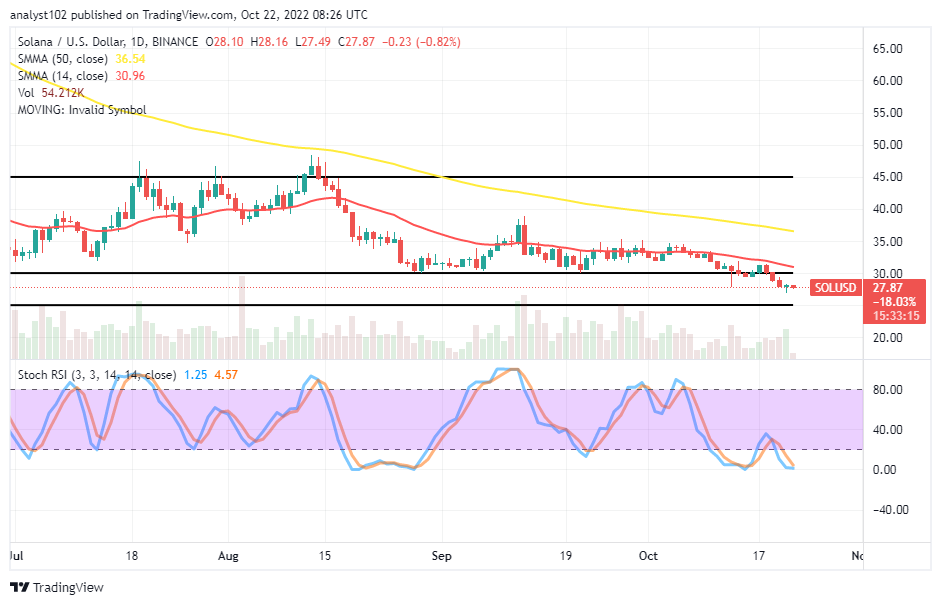
The SOL/USD daily chart showcases the market declines past the $30 trading spot after some failed trials in the wake of trying to push northward. The 14-day SMA indicator is at $30.96, underneath the $36.54 value line of the 50-day SMA indicator. The horizontal line drew at the point that makes parts of the headline that it has been representing a crucial trading zone over time. The Stochastic Oscillators have penetrated the oversold region to the range values of 4.57 and 1.25.
Will the SOL/USD market decline to the $25 support level?
The SOL/USD market activity tends to depreciate to $25 support as the crypto price declines past $30. Execution of a pending buying order around the immediate support value would save the time of checking or being alert to make an instant execution. Even though that presumption is reasonable, long-position placers should use caution when making a relaunch, even as the forces to the downside are on the decline.
On the downside of the technical analysis, the trading zone around the $30 level has been the spot against getting an upward-smooth running to portend for affirmation of a bullish-dominating trading cycle. The moment that that presumption happens, selling activities will have to suspend. But, in the meantime, bears may push for exhaustion toward the $25 support level. The emergence of a bullish candlestick at any point from now will dowse the declining motion tension.
SOL/BTC Price Analysis
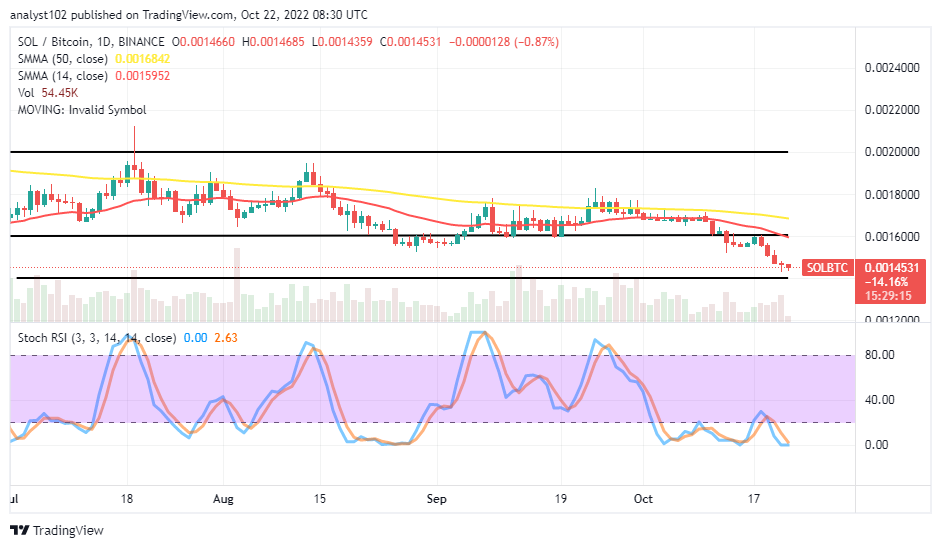
In comparison, Solana has resorted to a downsizing moment in the last few days, not lesser than four against Bitcoin. The cryptocurrency pair market declines past the smaller SMA’s trend line value. The 50-day SMA indicator is above the 14-day SMA indicator. The Stochastic Oscillators are in the oversold region, keeping 2.63 and 0.00 range values. That signals that the base trading crypto may soon be struggling against the trending force of its counter-trading crypto.
- Related
- How to Buy D2T Token
Join Our Telegram channel to stay up to date on breaking news coverage
