Join Our Telegram channel to stay up to date on breaking news coverage
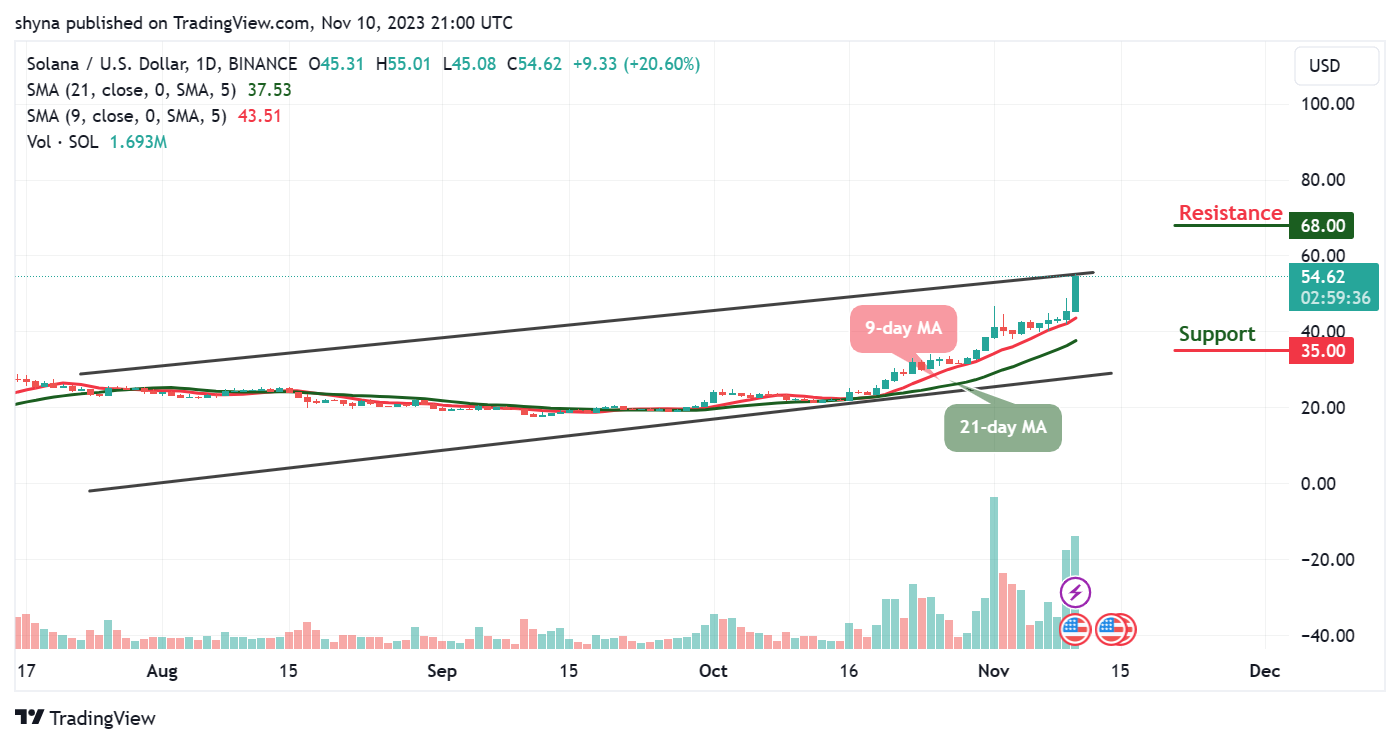
The Solana price prediction shows that SOL moves to cross above the upper boundary of the channel as the coin touches the $55.01 level.
Solana Prediction Statistics Data:
- Solana price now – $54.62
- Solana market cap – $26.3 million
- Solana circulating supply – 421 million
- Solana total supply – 562.1 million
- Solana CoinMarketCap ranking – #6
SOL/USD Market
Key Levels:
Resistance levels: $68, $70, $72
Support levels: $35, $33, $31

SOL/USD is trading at $54.62 at the time of writing and it is likely to cross above the upper boundary of the channel if the bulls increase the pressure. However, if the buyers were able to keep the price above the 9-day and 21-day moving averages, the market price could rally toward the upside.
Solana Price Prediction: Solana Could Create Additional Gains
According to the daily chart, the Solana price is moving close to the resistance level of $60 as the coin prepares to create an additional gain. The technical indicators confirm that the market is moving to the upside with the signal line pointing up to indicate a buy signal.
Nevertheless, if the buyers were able to keep the price above the moving averages, the Solana price may cross above the upper boundary of the channel to hit the potential resistance levels of $68, $70, and $72 while sliding below the moving averages could bring the coin to the supports at $35, $33, and $31 respectively.
SOL/BTC Begins the Upward Movement
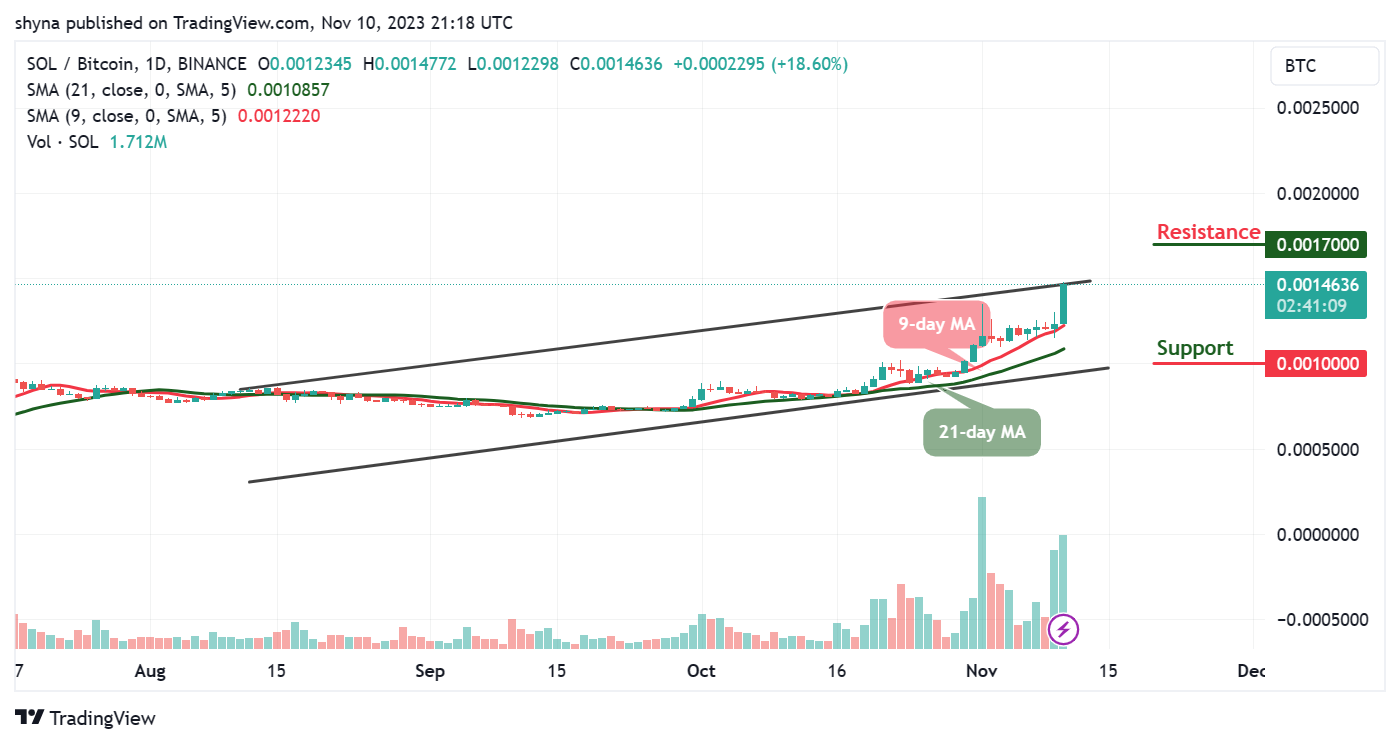
Against Bitcoin, the Solana price is moving upward, and it could swing high to cross above the upper boundary of the channel which could locate the resistance level of 1700 SAT and above. On the other hand, if the market price slides below the 9-day and 21-day moving averages, it could reach the support level of 1000 SAT and below.

However, the 9-day MA is currently moving above the 21-day MA as the signal line points to the north to confirm the bullish movement. Moreover, any further bullish movement toward the upside may create additional gains within the channel.
Alternatives to Solana
The Solana price is beginning to create a new uptrend at the time of writing. However, traders can see that this crypto’s difficult period is over as it is heading toward the upside. A break above the resistance level of $60 could encourage more buyers to increase their entries, which could later push the price toward the resistance. Meanwhile, if the sellers push lower, traders can expect very strong support at $45 before heading toward the lower boundary of the channel.
Nonetheless, investors should consider Bitcoin Minetrix, a new token that has already raised over $3.80 million in its presale, showcasing strong early investor confidence. Despite Solana’s current bullish trend, Bitcoin Minetrix’s potential for dynamic growth positions it as an enticing opportunity for investors to enter early and potentially outpace more established tokens like Solana soon. Don’t miss out on being part of the ground-breaking journey with Bitcoin Minetrix!
Join Our Telegram channel to stay up to date on breaking news coverage


