
Join Our Telegram channel to stay up to date on breaking news coverage
The Solana price prediction shows that SOL may need to break above the upper boundary of the channel if the upside momentum gains traction.
Solana Prediction Statistics Data:
- Solana price now – $23.33
- Solana market cap – $8.8 billion
- Solana circulating supply – 383.6 million
- Solana total supply – 539.3 million
- Solana Coinmarketcap ranking – #10
SOL/USD Market
Key Levels:
Resistance levels: $30, $32, $34
Support levels: $15, $13, $11
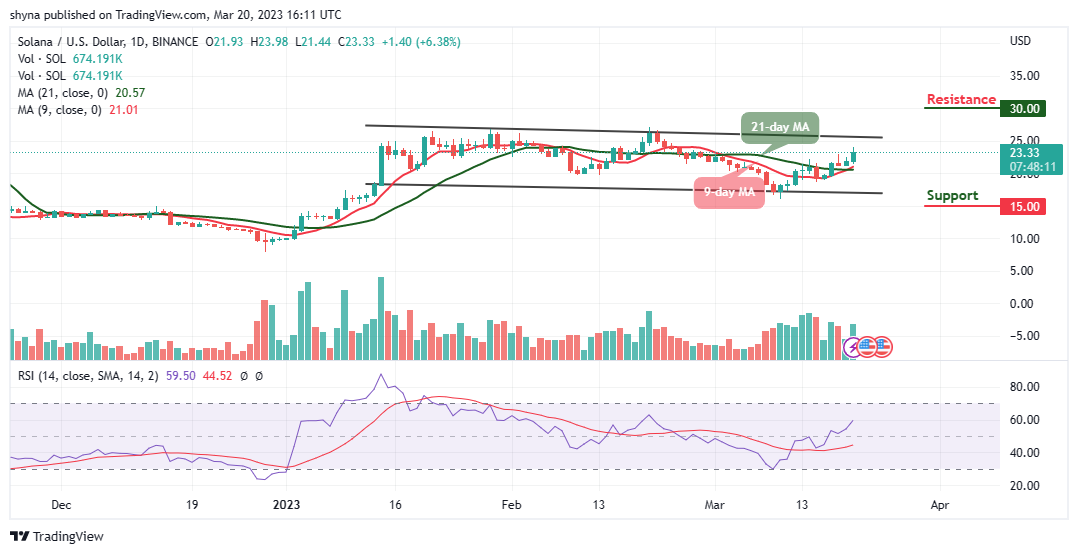
SOL/USD has gained over 6.38% since the beginning of the day to trade at $23.3. The Solana (SOL) has become one of the consistent cryptos in the last few days as the coin keeps hovering above the 9-day and 21-day moving averages. At the moment, the coin’s total market value is registered at $8.8 billion, while its total supply is $539.3 million.
Solana Price Prediction: What to Expect from Solana
On the daily chart, the Solana price is initially supported by $21, and if this level is broken, the sell-off may locate the nearest support at $18. Meanwhile, if the price crosses below the 9-day and 21-day moving averages, the sell-off is likely to continue with the next focus at $15, followed by $13 and $11 support levels.
On the upside, the market may need to see a sustainable move above the daily high at $23.98 for the upside to gain traction. The next resistance may now be created above the upper boundary of the channel while the potential resistance could be located at $30, $32, and $34 respectively. The Relative Strength Index (14) on the daily chart is moving to cross above the 60-level, signaling that an extended recovery may be underway.
Against Bitcoin, the market price is trying to make a bullish cross above the 9-day moving average. But currently, sellers and buyers are both dragging the market about who will dominate. However, the market price is likely to cross above the 21-day moving average as the technical indicator, Relative Strength Index (14) crosses above the 40-level.
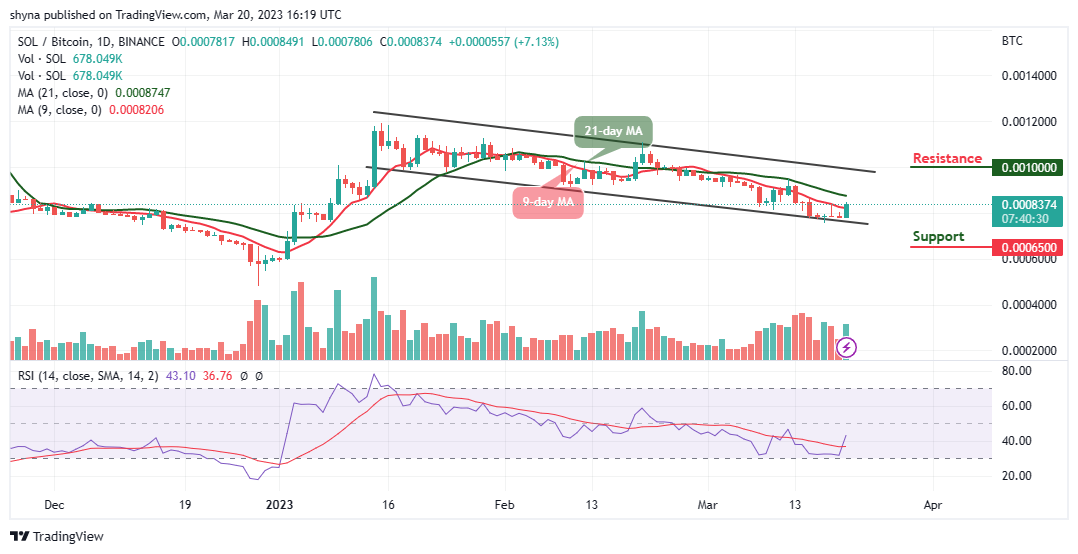
Looking at the daily chart, the bulls are making effort in building the confidence to increase their entries. Therefore, if the bulls succeed in breaking above the upper boundary of the channel, traders expect the market to reach the resistance level of 1000 SAT and above while a bearish cross below the lower boundary of the channel could hit the support at 650 SAT and below.
Alternatives to Solana
The Solana price is currently trading at $23.33 after touching the daily low of $21.44 and it is likely to cross above the upper boundary of the channel. However, if the buyers were able to keep the price above the 9-day and 21-day moving averages, the market price could rally toward the upside. However, the LHINU token maintains the fundamental principle of decentralization by protecting voters’ identities. Therefore, this makes it easy to join the community, buy tokens, stake LHINU, and vote on topics. At the time of writing, the Love Hate Inu has raised close to $2 million in the presale.
Join Our Telegram channel to stay up to date on breaking news coverage