
Join Our Telegram channel to stay up to date on breaking news coverage
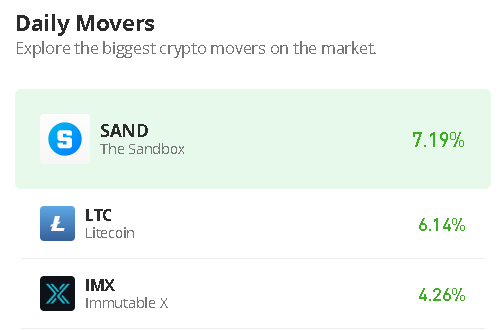
The Sandbox price prediction shows that SAND heads toward the upper boundary of the channel as the coin touches the $0.57 level.
Sandbox Prediction Statistics Data:
- Sandbox price now – $0.56
- Sandbox market cap – $1 billion
- Sandbox circulating supply – 1.8 billion
- Sandbox total supply – 3 billion
- Sandbox Coinmarketcap ranking – #43
SAND/USD Market
Key Levels:
Resistance levels: $0.70, $0.75, $0.80
Support levels: $0.40, $0.35, $0.30
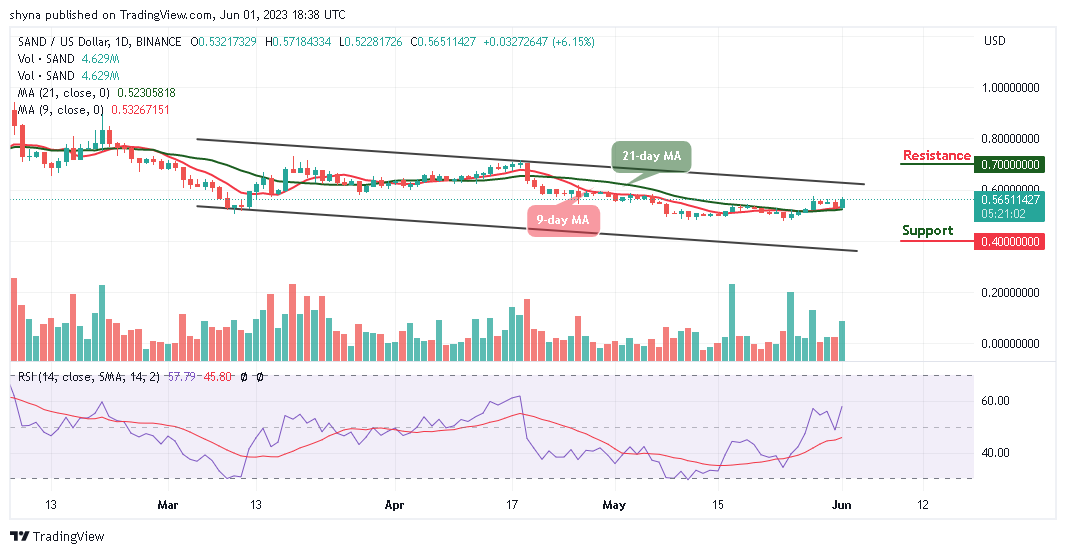
SAND/USD is currently trading at $0.56 after touching the daily high of $0.57 and it is likely to cross above the upper boundary of the channel. However, if the buyers were able to keep the price above the 9-day and 21-day moving averages, the market price could rally toward the upside.
Sandbox Price Prediction: Sandbox Gets Ready for Upward Movement
According to the daily chart, the Sandbox price is moving close to the resistance level of $0.60 as the coin prepares to create an additional gain. The technical indicator Relative Strength Index (14) is also moving to cross above the 60-level with the signal line pointing up to indicate a buy signal.
Nevertheless, if the buyers were able to keep the price above the moving averages, the Sandbox price may cross above the upper boundary of the channel to hit the potential resistance levels of $0.70, $0.75, and $0.80 while crossing below the moving averages may bring the coin to the supports at $0.40, $0.35, and $0.30 respectively.
Against Bitcoin, the Sandbox price is moving to cross above the upper boundary of the channel, and it could swing high above this barrier to locate the resistance level of 2500 SAT and above. Meanwhile, if the market price slides below the 9-day and 21-day moving averages, it could reach the support level of 1700 SAT and below.
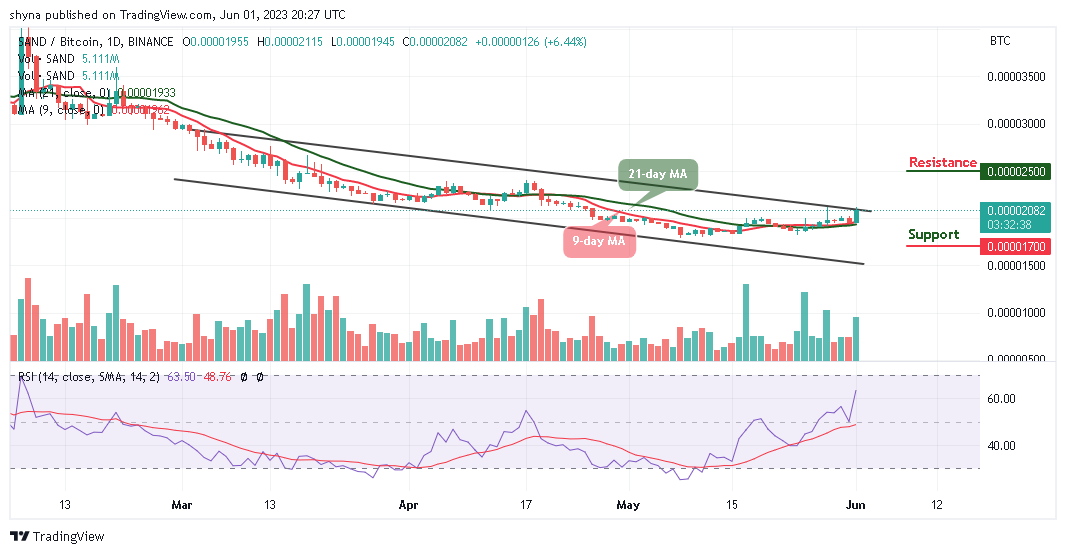
However, the technical indicator Relative Strength Index (14) is currently moving above the 60-level as the signal line points to the north to confirm the bullish movement. Moreover, any further bullish movement toward the upside may create additional gains for the coin.
Alternatives to Sandbox
The daily chart reveals that the Sandbox market operation increases in featuring lower highs in a sequential-moving order as the coin spikes above the 9-day and 21-day moving averages. In the event of a deep pullback, the $0.57 level could once more come into play and hold the market. However, the early-bird investors have rushed to snap up $WSM, given that it’s underpinned by the colossal strength of the Wall Street Memes community, which is formed of more than 400,000 “degens” across several social media platforms. Meanwhile, now that the Wall Street Memes team has entered the crypto market, anticipation is already building as it has raised almost $2 million in its presale so far.
Read more:
New OKX Listing - Wall Street Memes

- Established Community of Stocks & Crypto Traders
- Featured on Cointelegraph, CoinMarketCap, Yahoo Finance
- Rated Best Crypto to Buy Now In Meme Coin Sector
- Team Behind OpenSea NFT Collection - Wall St Bulls
- Tweets Replied to by Elon Musk
Join Our Telegram channel to stay up to date on breaking news coverage