
Join Our Telegram channel to stay up to date on breaking news coverage
Rocket Pool price leads the gains in the crypto market on Friday recording 12% gains in the last 24 hours. This is against a background of losses across the board with the big crypto Bitcoin trading below the $22,000 mark after dropping 3.31% on the day. Other top-cap cryptocurrencies are also flashing red with Cardano (ADA) coming in as the biggest loser, down 5.84% on the day, among the largest assets by market cap.
Data from CoinmarketCap shows that the global cryptocurrency market capitalization is down 3.96% over the last day to stand at $1.02 trillion. The total crypto market volume is $74.67B, which makes a 14.14% increase over the last 24 hours. The total volume in DeFi is currently $8.13B, 10.89% and that of all stablecoins is now $62.03B, making 10.89% and 83.07% of the total crypto market 24-hour volume respectively.
Rocket Pool Price Uptrend Is Intact
RPL’s impressive 119% rally from the $20 support wall at the beginning of January was halted at the $43.83 resistance line. A price analysis by the InsideBitcoins team using Fibonacci retracement levels on February 6 projected a possible uptick to the 150% level at $55.
This level was tested during the early Asian trading session on Friday when the Rocket Pool price rose past the said level to reach an intraday high of $57.2 (see chart below). The long upper wick on today’s candlestick shows the determination of the sellers to defend the resistance offered by the 150% Fibonacci level which has pulled RPL down to the current price of $52.9.
However, the token is trading in the second straight bullish session and the long bullish engulfing candle witnessed yesterday attests to how strong the uptrend is. As such, if the uptrend is sustained, the price may climb higher with the first line of defense emerging from the 150% retracement level at $55 and then the intraday high above $57.
Clearing these hurdles would signal the ability of the buyers to sustain the uptrend. As such, the price may rise higher to tag $60 and later toward the $70% psychological level. This would bring the total gains to 32.12%.
RPL/USD Daily Chart
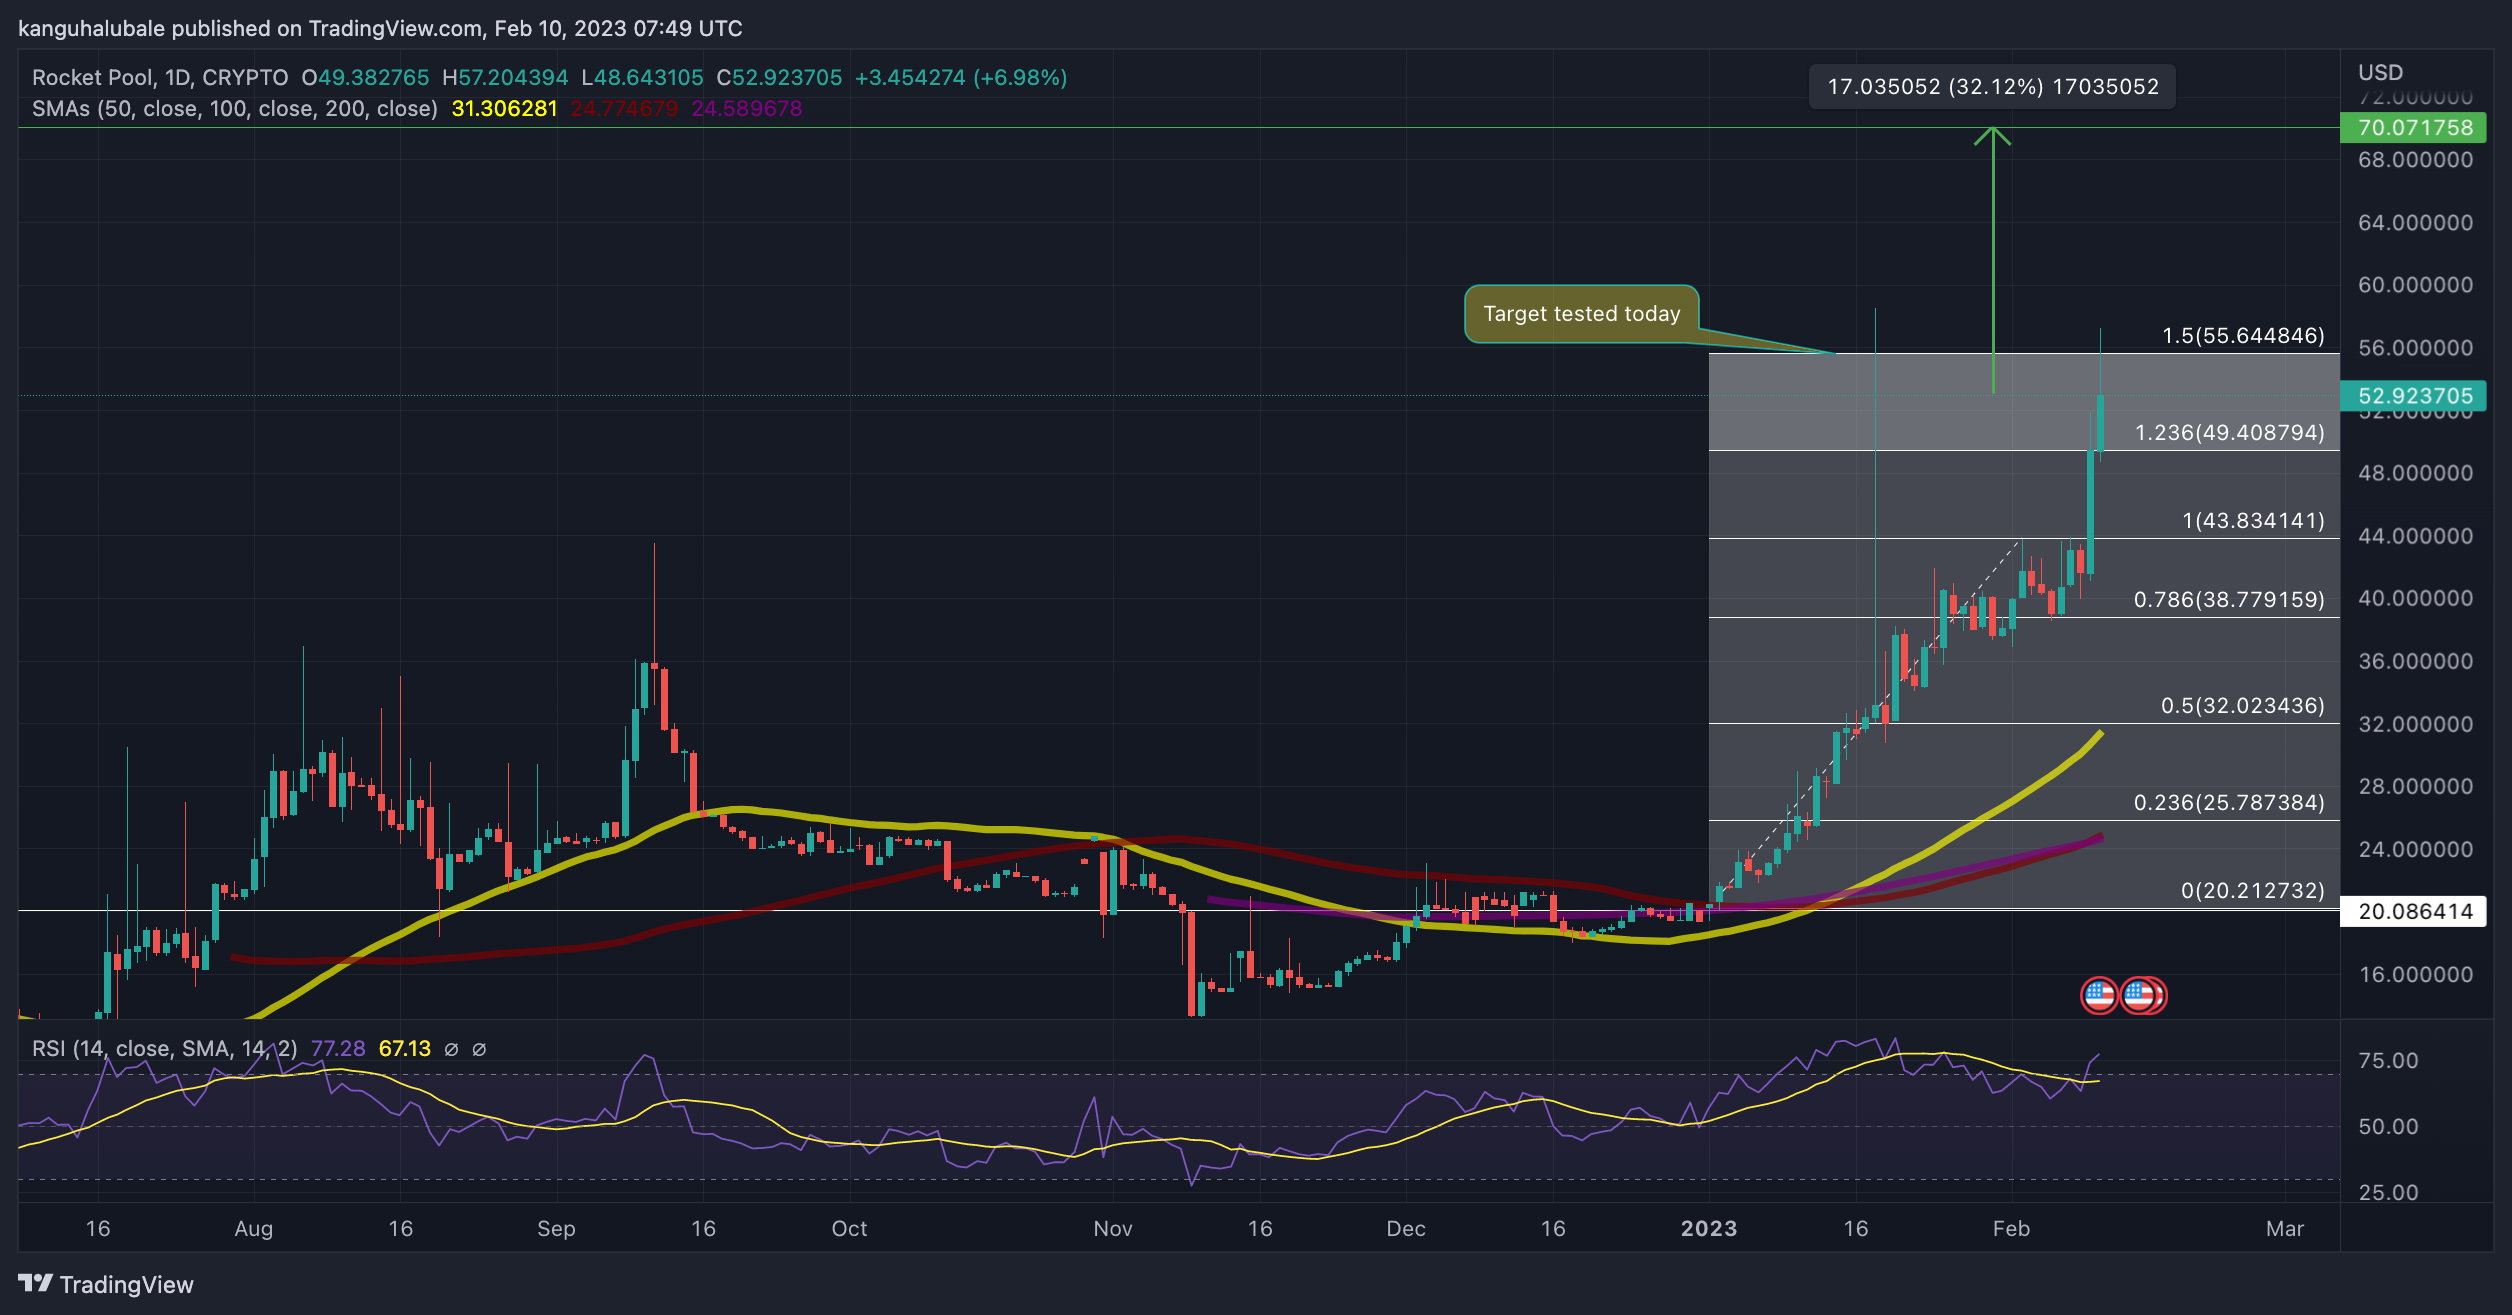
RPL’s positive outlook was supported by the up-facing moving averages and the upward movement of the Relative Strength Index (RSI). The price strength at 77 suggested that the buyers were in full control of Rocket Pool.
Also supporting the bullish thesis for the Rocket Pool price was the SuperTrend indicator which was still bullish after turning from red to green and flipping below the price on December 3, marking the beginning of the uptrend. The indicator overlays the chart, just like moving averages, but uses average true range (ATR) readings to gauge the volatility of the price.
Note that buying pressure will keep bolstering the price higher as long as the SuperTrend indicator holds below RPL, as observed on the chart.
Moreover, the Directional Movement Index (DMI) also added credence to the strength of Rocket Pool’s uptrend. The positive directional line (+D1) at 47 was way above the negative directional line (-D1) at 5. The position of the average directional line (ADX) at 73 suggested that the uptrend was very strong.
RPL/USD Daily Chart
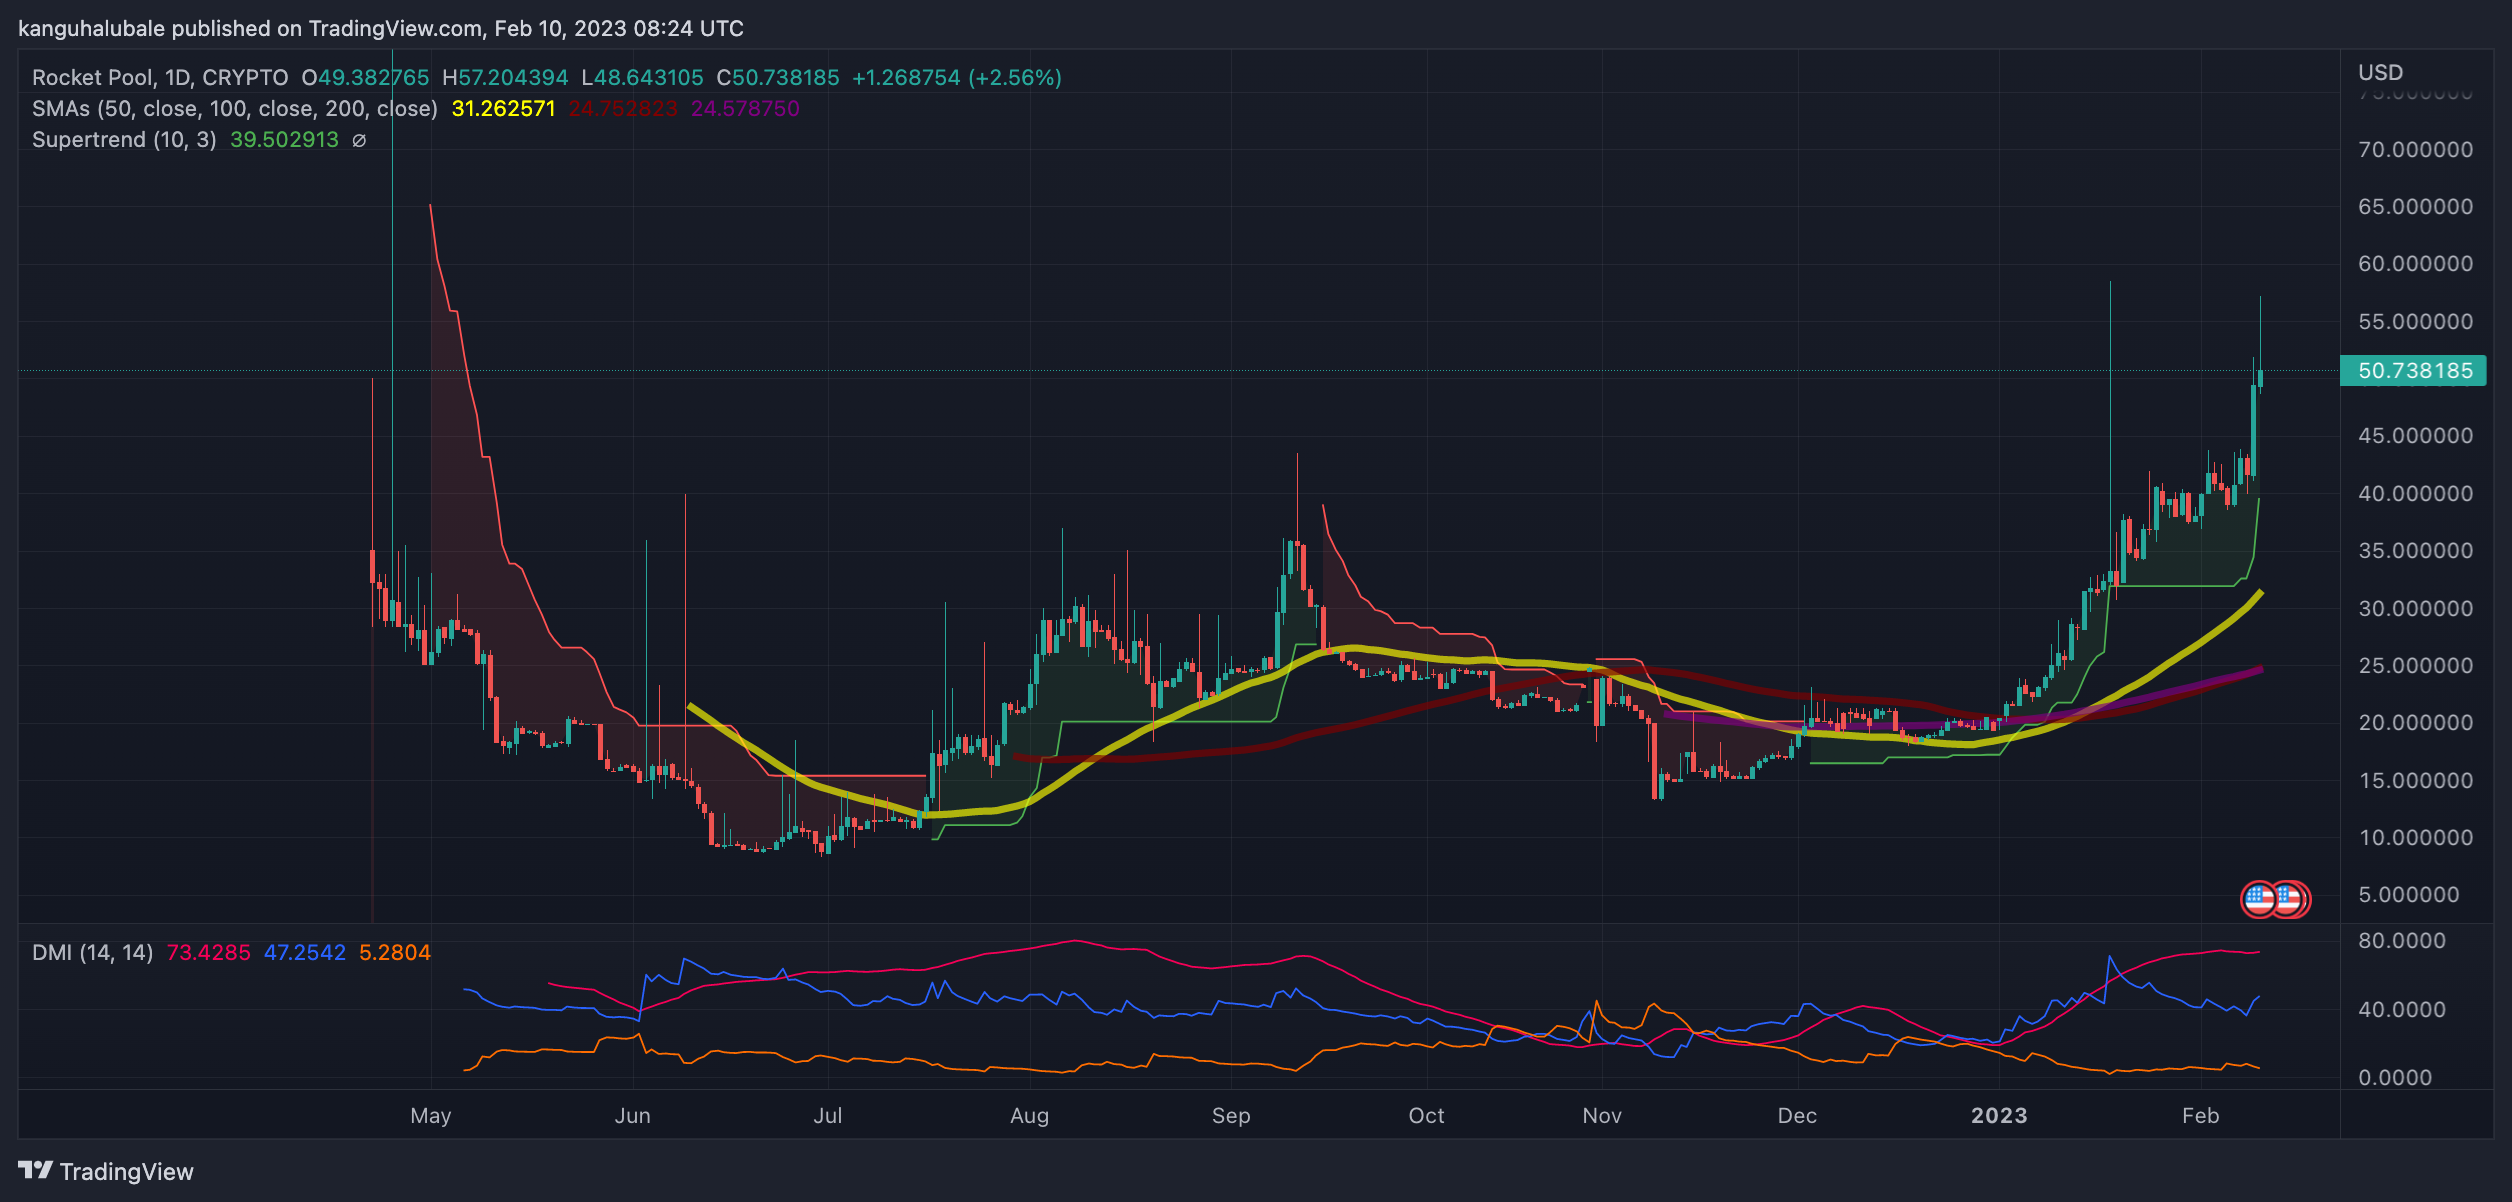
Furthermore, the chart showed that RPL sat on strong support areas on the downside. These were defense zones embraced by the 50-day simple moving average (SMA) at $31 and the $24 support level where both the 100-day and 200-day SMAs converged.
Data from IntoTheBlock’s In/Out of the Money Around Price (IOMAP) model shows that the immediate support offered by the $50 psychological level, embraced by the 123.6% retracement level, is stronger compared to the immediate resistance at $53. This demand zone is found within the $49.93 and $51.46 price range where approximately 170,050 RPL tokens were previously bought by 83 addresses.
RPL IOMAP Chart
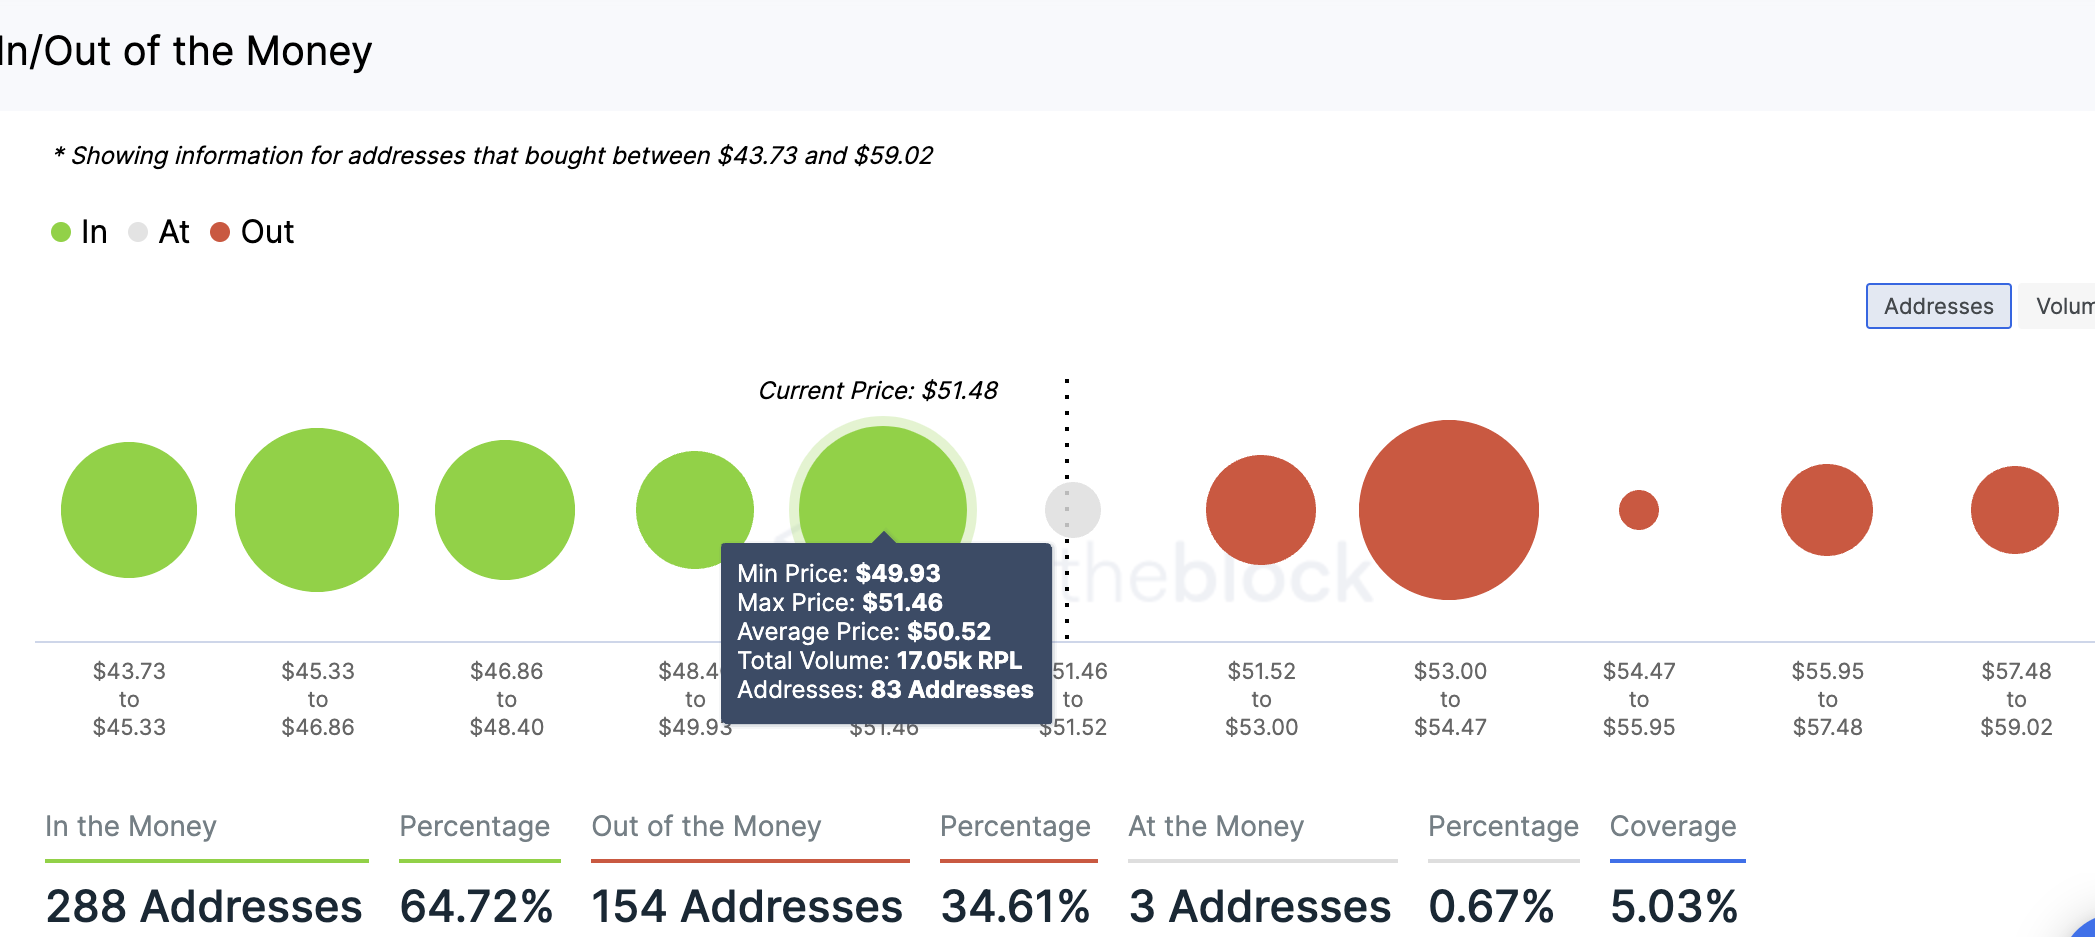
Any attempts to pull the price below this level would be met by immense buying from this cohort of investors who may want to increase their profits. The same IOMAP chart also showed that the path with the least resistance for the Rocket Pool price is upward.
On the flip side, the position of the RSI in the overbought region suggested that the recovery may soon run out of steam, occasioning a correction. As such, a daily candlestick below the immediate support level at $50, would clear the path for sell-off. The first foothold would emerge from the 100% Fibonacci retracement at $43.8, and then the 78.6% extension level at $38.
Traders could expect RPL to take a breather here. This would give the bulls time to regroup and buy the token at lower levels before continuing the uptrend.
Read More:
- 5 Best Metaverse & P2E Crypto to Buy in 2023? | RobotEra, Meta Masters Guild, Sandbox & More
- Robinhood Crypto Trading Revenue Takes A Big Dip
Join Our Telegram channel to stay up to date on breaking news coverage