

Join Our Telegram channel to stay up to date on breaking news coverage
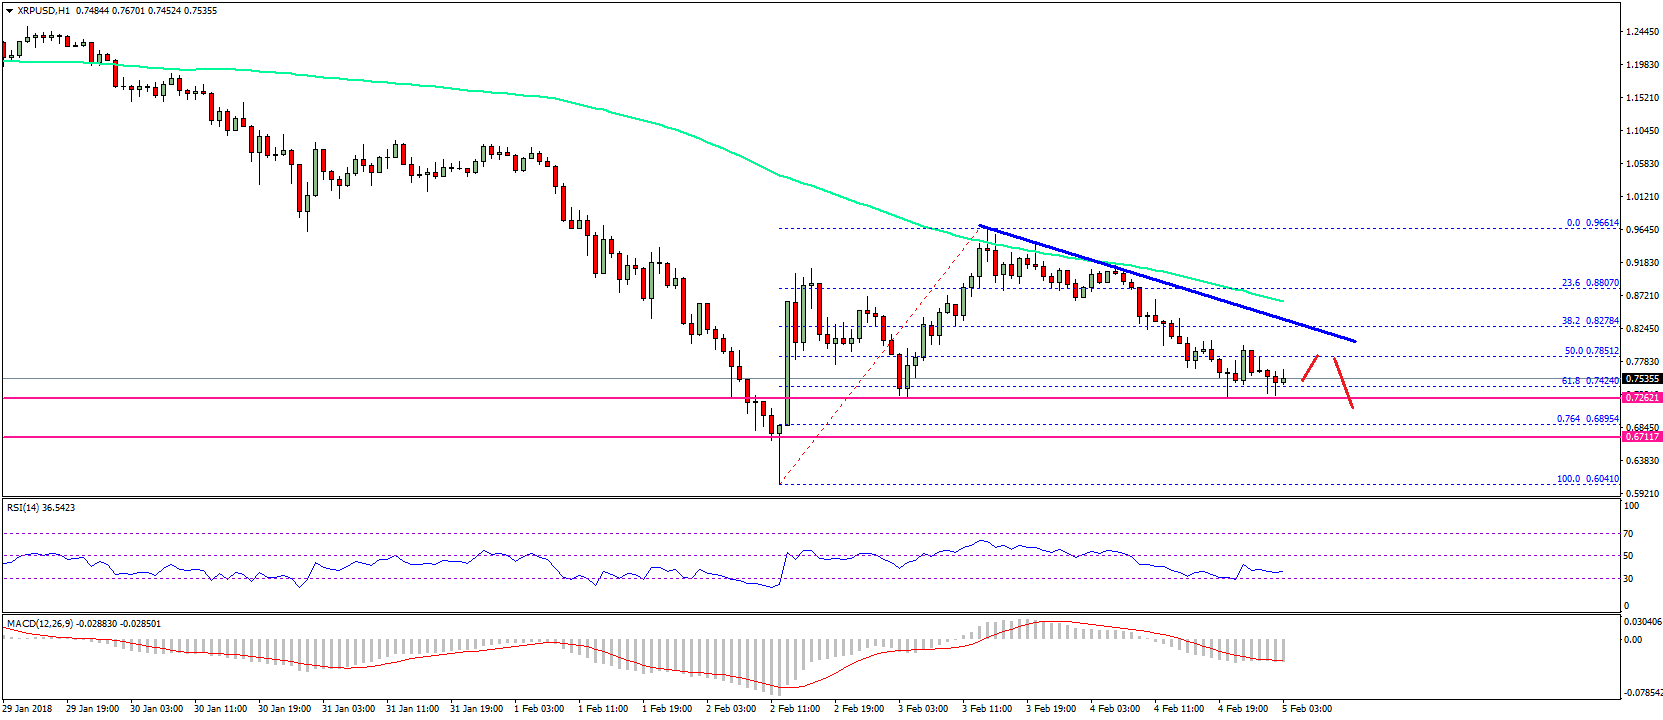
Key Highlights Ripple price struggled to move above the $0.9500 resistance area and declined again against the US dollar. There is a major bearish trend line forming with resistance at $0.8000 on the hourly chart of the XRP/USD pair (data source from SimpleFx). The pair is currently trading near a major support area at $0.7500-0.7700, which holds a lot of importance.
Ripple price failed to recover substantially against the US Dollar and Bitcoin. XRP/USD is currently near $0.7600, which must hold to avoid further declines.
Ripple Price Resistance
We saw a recovery recently in Ripple price from the $0.6041 swing low against the US Dollar. The price moved above the $0.8500 and $0.9000 resistance levels. However, it failed to move above the $0.9500 and $0.9600 resistance levels. As a result, a downside move was initiated and the price moved below the $0.9000 support. There was a break below the 50% Fib retracement level of the last wave from the $0.6041 low to $0.9661 high.
More importantly, the upside move was protected by a major bearish trend line with resistance at $0.8000 on the hourly chart of the XRP/USD pair. The pair is currently trading near the $0.7500 support area. Moreover, it is holding the 61.8% Fib retracement level of the last wave from the $0.6041 low to $0.9661 high. It must stay above the $0.7500 support area to avoid any further declines. If it fails to stay above $0.7500, there is a chance of XRP sliding back towards $0.7000.
The next major support is at 76.4% Fib retracement level of the last wave from the $0.6041 low to $0.9661 high at $0.6895. On the upside, the price has to break the $0.8000 and $0.8200 resistance levels to gain upside momentum.
Looking at the technical indicators:
Hourly MACD – The MACD for XRP/USD is back in the bearish zone.
Hourly RSI (Relative Strength Index) – The RSI for XRP/USD is currently well below the 50 level.
Major Support Level – $0.7500
Major Resistance Level – $0.8200
Charts courtesy – SimpleFX
The post Ripple Price Technical Analysis – XRP/USD Holding Key Support appeared first on NewsBTC.
Join Our Telegram channel to stay up to date on breaking news coverage