Join Our Telegram channel to stay up to date on breaking news coverage
XRP Price Analysis – March 11
Yesterday, the price of Ripple improved but the coin is now consolidating in an intraday zone between 0.199 and 0.218.
XRP/USD Market
Key Levels:
Resistance levels: $0.26, $0.28, $0.30
Support levels: $0.15, $0.13, $0.11
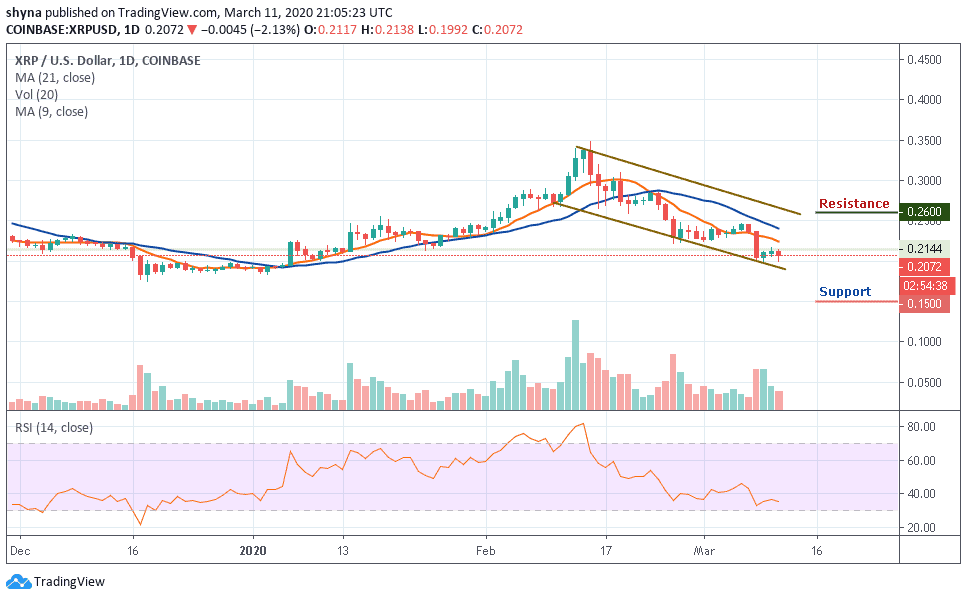
The daily chart reveals that the Ripple price has continued to demonstrate a sign of weakness across its markets. Now, the XRP/USD market is down by 2.13%, reflecting a price drop in the market and the fall might become heavy if the bearish action continues.
Meanwhile, the third largest-cryptocurrency witnessed a bullish drive against USD yesterday but currently trading at $0.207. Therefore, since the XRP/USD is following a sideways movement on a short-term outlook as it has been revealed by RSI (14) indicator, traders may expect the trend to break above the 9-day and 21-day moving averages if the price actions still remain inside the channel.
Moreover, a channel breakout could strengthen the bulls and this could push the price to the resistance levels of $0.26, $0.28 and $0.30 or a channel breakdown might lead the market in a bearish scenario if the price continues to fades and the closest supports to keep an eye on are $0.15, $0.13, and $0.11.
Against Bitcoin, for the past few weeks now, Ripple (XRP) has been falling below the moving averages but a couple of days ago, the bulls are trying to step back into the market as they maintain an upward movement towards the 9-day and 21-day MAs. Now that the bull appears to be stepping back, we can expect the price-rise to 2900 SAT and 3000 SAT resistance levels.
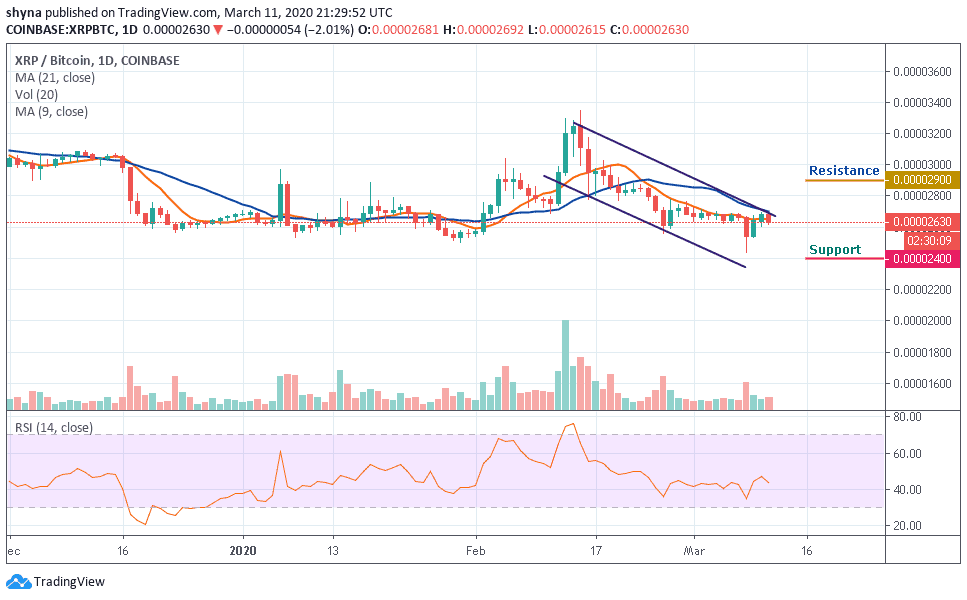
However, if the sellers continue to push the price down as it is now to break the moving averages within the descending channel, the next support level is located at 2500 SAT and further support is found at 2400 SAT and 2300 SAT. The RSI (14) is moving below the 45-level, which may likely give more strength to the sellers.
Please note: Insidebitcoins.com is not a financial advisor. Do your research before investing your funds in any financial asset or presented product or event. We are not responsible for your investing results.
Join Our Telegram channel to stay up to date on breaking news coverage