Join Our Telegram channel to stay up to date on breaking news coverage
XRP Price Prediction – January 9
XRP/USD, at the time of penning down this analysis, was trading at $0.2038. The price lacks imminent support and therefore, trades in the red with dense selling pressure.
XRP/USD Market
Key Levels:
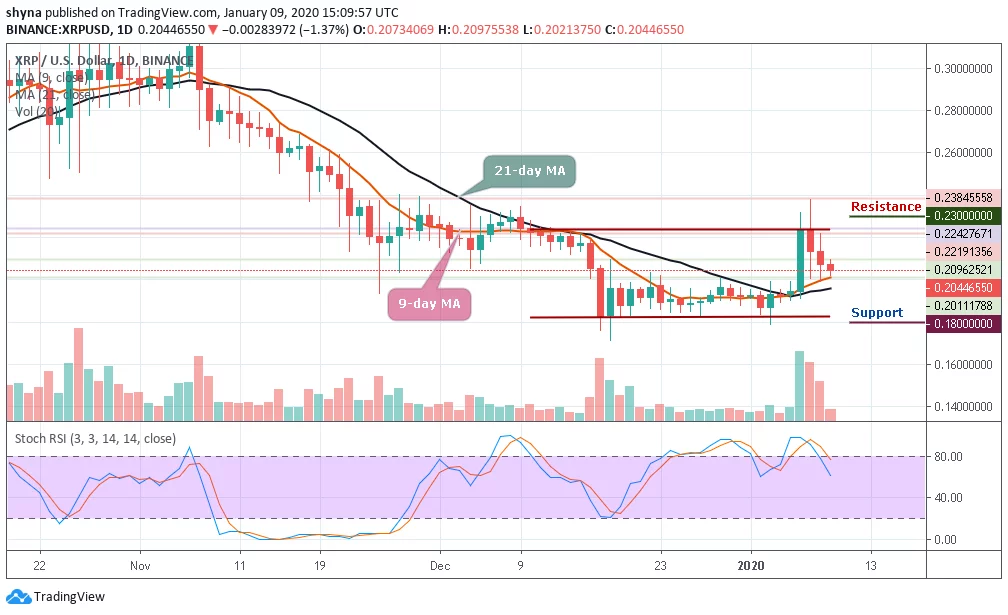
Resistance levels: $0.23, $0.24, $0.25
Support levels: $0.18, $0.17, $0.16
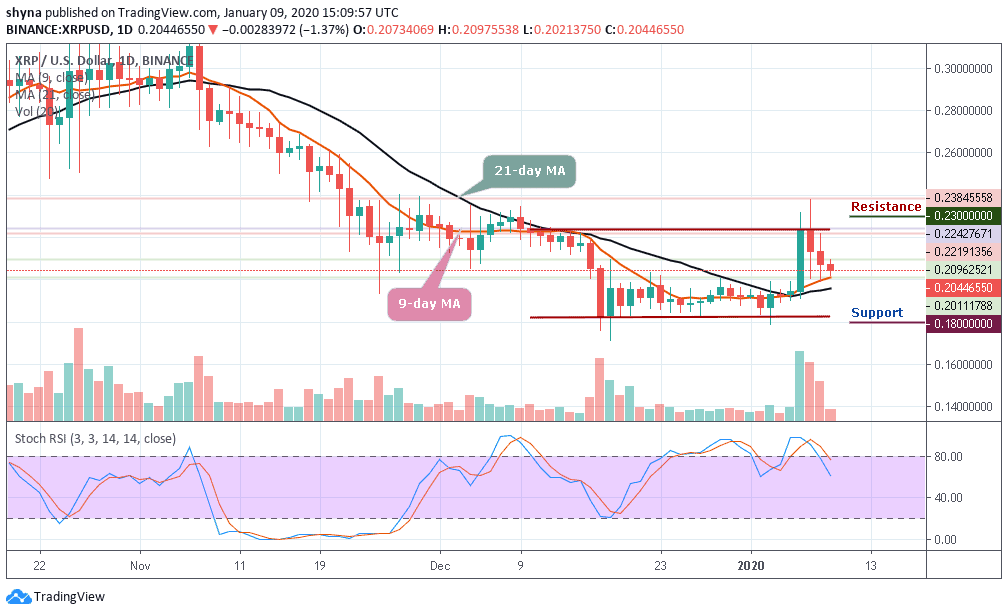
XRP/USD price is seen correcting downwards after having hit the resistance at $0.225. The king of the cryptocurrencies (Bitcoin) is also seen trading below $8,000 and has an impact on the overall trading volume and market cap as well. Currently, the coin is exhibiting an intraday dip and bearish move, alongside, lack of support.
However, the daily chart reveals that the coin is seen correcting downwards after having soared at $0.224. Unable to hit the resistance, the coin is moving towards the major support at $0.200. But once the coin rightly gains the required momentum, it is ought to bounce back and retest the formed resistance.
At the moment, the stochastic RSI faces the south with its signal lines moving out of the overbought zone. Should the bulls prevail over the bears by moving the price back to $0.224, XRP/USD pair may rally towards the $0.23, $0.24 and $0.25 resistance levels. But if the bears try to push the price below the 9-day and 21-day moving averages; the price could find its low at the support levels of $0.18, $0.17 and $0.16 respectively.
Against Bitcoin, for the past couple of days now, Ripple (XRP) fell drastically below the moving averages but today, the bulls are trying to step back into the market as they maintain an upward movement towards the 9-day and 21-day MAs. Now that the bull appears to be stepping back, we can expect the price-rise to 2750 SAT and 2850 SAT resistance levels.
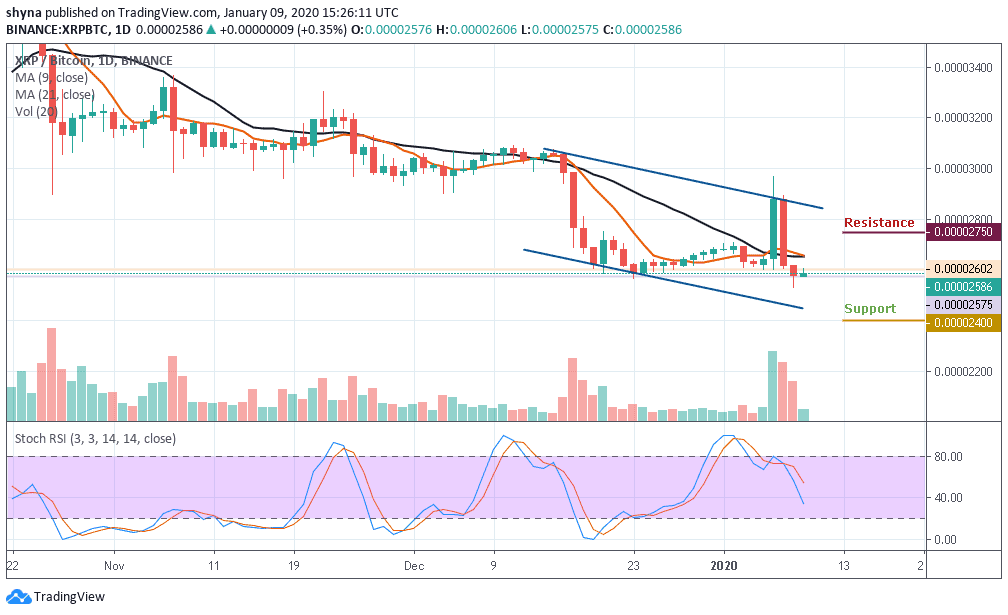
However, if the sellers continue to push the price down to break the trend line of the descending channel, the next support level is located at 2500 SAT and further support is found at 2400 SAT and 2300 SAT. The stochastic RSI is moving below the 40-level, which may likely give more strength to the sellers.
Please note: Insidebitcoins.com is not a financial advisor. Do your research before investing your funds in any financial asset or presented product or event. We are not responsible for your investing results.
Join Our Telegram channel to stay up to date on breaking news coverage