Join Our Telegram channel to stay up to date on breaking news coverage
XRP Price Prediction – November 25
The XRP/USD price has dropped from $0.22 to $0.19 within 24 hours. The RSI indicator (14) is oriented within the oversold zone.
XRP/USD Market
Key Levels:
Resistance levels: $0.24, $0.26, $0.28
Support levels: $0.17, $0.15, $0.13
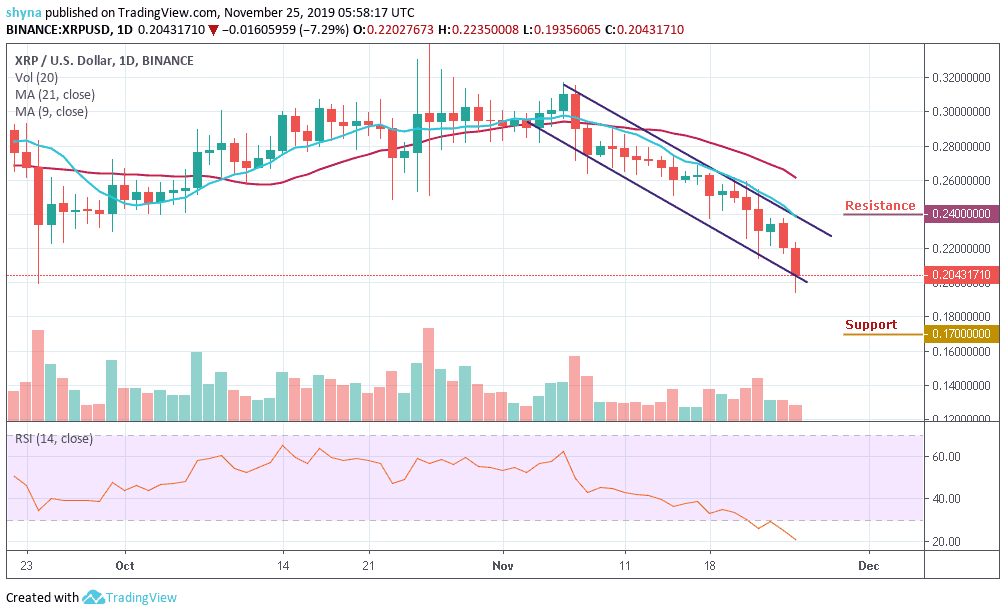
The Ripple price was not spared by the cyclone-like bearish wave that swept the market last week. The bearish price action remained intact during the weekend session with a target set at $0.20. Unfortunately, the downward trend is at its peak and the XRP/USD still has eyes on $0.19. According to the current technical chart, the Ripple (XRP) will continue to explore the downside. Meanwhile, the RSI (14) is under 30 (oversold zone) emphasizes the rising bearish pressure.
Looking at the daily chart, recovery will not come easy for XRP and from a technical perspective as the coin is yet to find credible support and a buy zone where buyers will take a risk and bet on a significant reversal. The bears hold the XRP/USD market and the technical indicator remains within the oversold zone, suggesting a bearish action in the market. The price may continue to decline towards the critical support levels of $0.17, $0.15 and $0.13.
Moreover, the daily chart shows that the XRP/USD pair’s 9-day moving average around the $0.238 level is a key technical region that bulls need to break. The cryptocurrency’s 21-day moving average is located around the $0.24, $0.26 and $0.28 resistance levels, and a move above this key technical metric should encourage further XRP/USD buying.
When compared with Bitcoin, the pair is consolidating within the channel and moving above the 9-day and 21-day moving averages. Despite the sideways movement, the third-best performing cryptocurrency is yet to define an actual direction as price actions remained subdued with choppy price actions since the daily opening. Meanwhile, the buyers need to push the price above the channel to hit the resistance levels of 3300 SAT and above.
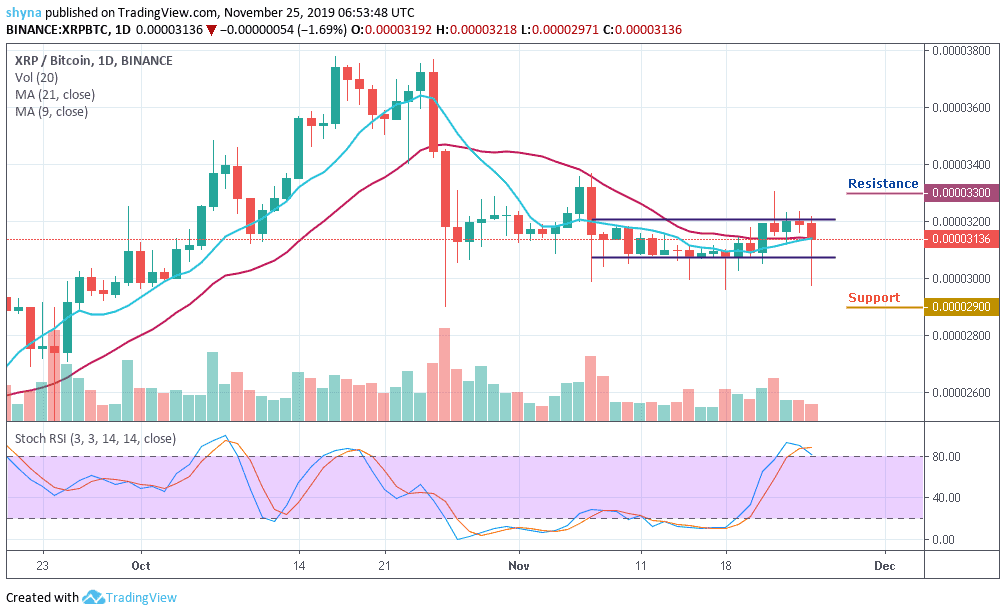
Moreover, looking at the daily chart, if the bulls failed to hold the price, then it may likely fall below the moving averages and the nearest support levels for the coin are 2900SAT and below. The stochastic RSI moves above level 80, which may start giving bearish signals once it moves from the overbought zone to face the south.
Please note: Insidebitcoins.com is not a financial advisor. Do your research before investing your funds in any financial asset or presented product or event. We are not responsible for your investing results.
Join Our Telegram channel to stay up to date on breaking news coverage