Join Our Telegram channel to stay up to date on breaking news coverage
XRP Price Prediction – November 11
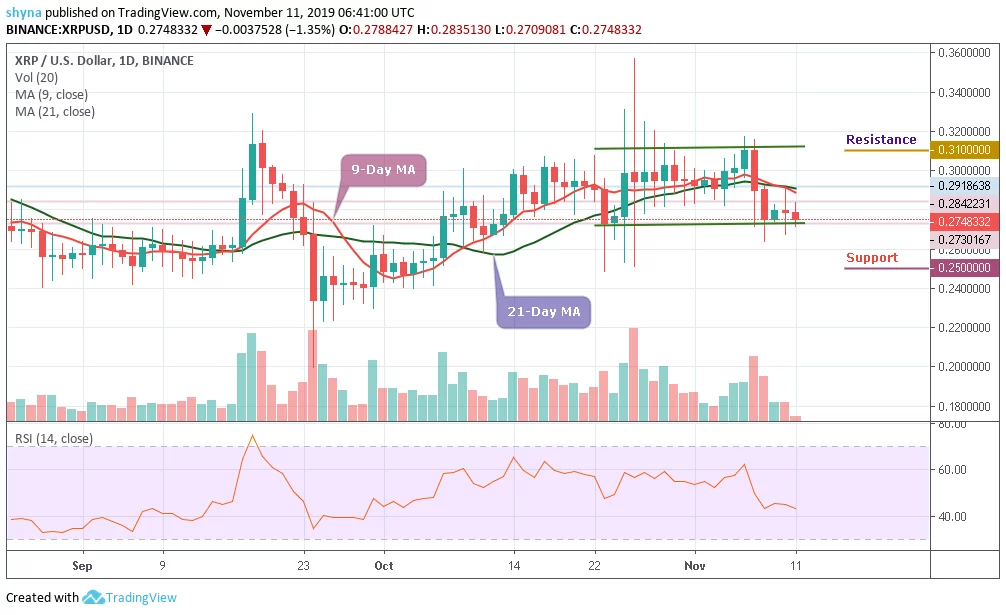
Ripple price is struggling to correct higher and it is likely to decline again if it fails to surpass $0.270 support.
XRP/USD Market
Key Levels:
Resistance levels: $0.310, $0.320, $0.330
Support levels: $0.250, $0.240, $0.230
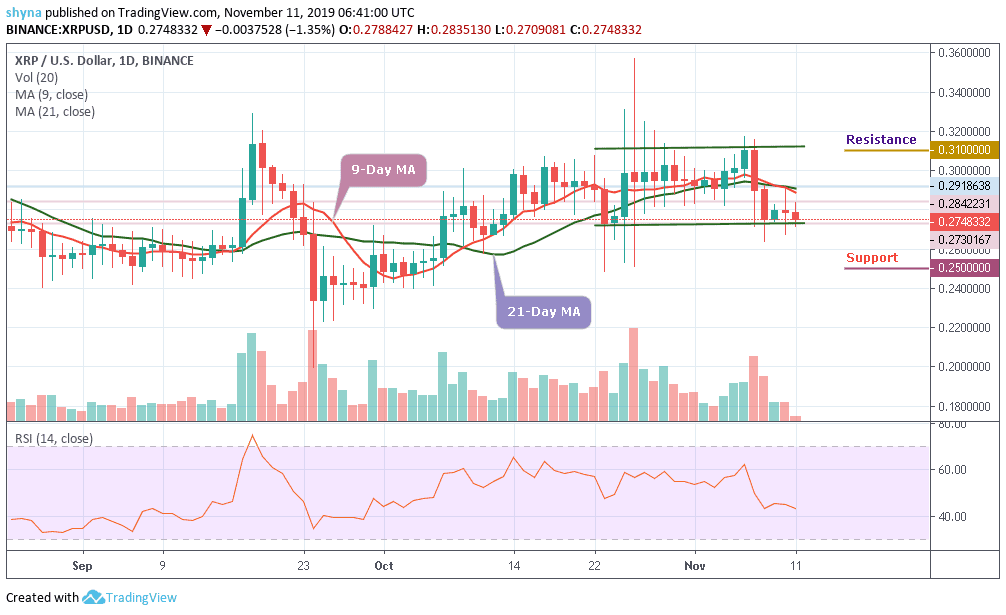
A few days ago, there was a sharp decline in Ripple below the $0.310 support level against the US Dollar. XRP/USD declined heavily and broke many supports near the $0.295 and $0.285 levels. Moreover, there was a close below the $0.285 level and the 9-day and 21-day moving averages. As a result of this, there was a break below $0.280 and the price traded as low as $0.270.
However, a sustainable move below $0.260 can be interpreted as a strong bearish signal. This level could serve as a buffer that separates XRP from an extended decline towards the support levels of $0.25, $0.24 and $0.23. In other words, for the upside, the buyers will need to make a sustainable move above $0.292 as soon as possible to halt the bearish movement.
Nevertheless, for the upside to gain traction, the coin needs to regain ground above $0.300, while $0.310, $0.320 and $0.330 resistance levels are the ultimate aims for the bulls. More so, the Relative Strength Index (RSI (14)) suggests that the selling pressure may keep dominating the market for now.
Comparing with Bitcoin, on the daily chart, Ripple (XRP) is becoming bleak although the price rises above the 3100 SAT. Now, the bull appears to be stepping back in the market, and if the movement continues in that trend, it may likely meet the nearest resistance at 3300 SAT, before the critical resistance levels of 3400 SAT and 3500 SAT. But as at the time of writing, XRP/BTC is changing hands at 3122 SAT.
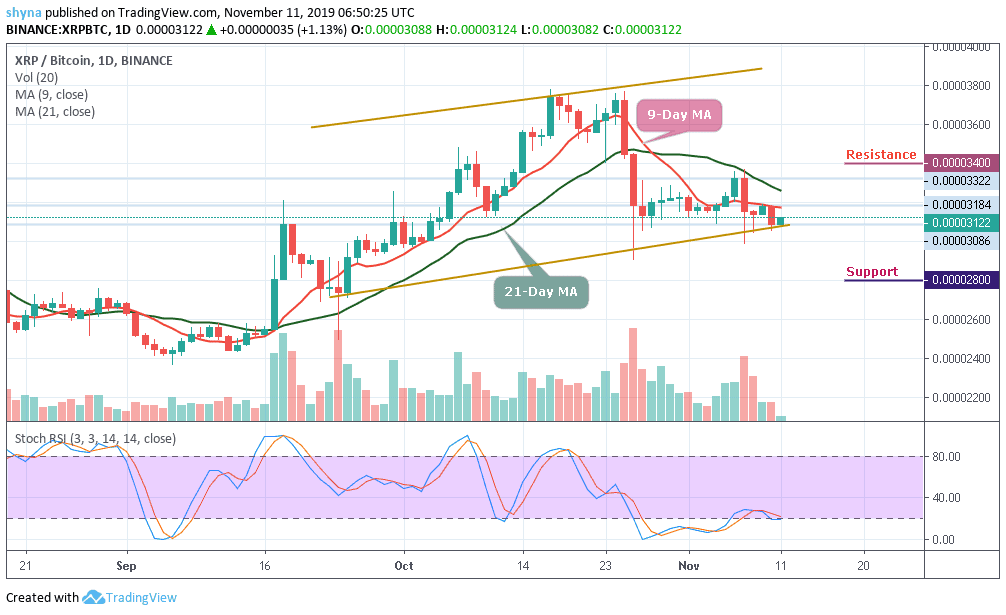
Moreover, if the sellers push the price beneath the current 3122 SAT, the next level of support is located at 3000 SAT and more support is found at 2800 SAT and 2700SAT. The trading volume has significantly decreased while the stochastic RSI is moving around the oversold zone, waiting for a break or bounce.
Please note: Insidebitcoins.com is not a financial advisor. Do your research before investing your funds in any financial asset or presented product or event. We are not responsible for your investing results.
Join Our Telegram channel to stay up to date on breaking news coverage