Join Our Telegram channel to stay up to date on breaking news coverage
XRP Price Prediction – November 8
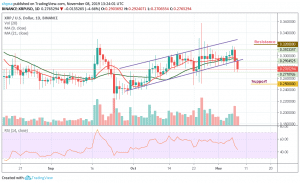
Looking at the daily chart, XRP/USD is breaking out of a rising ascending channel as the price failed to gather enough momentum to properly break down $0.31.
XRP/USD Market
Key Levels:
Resistance levels: $0.32, $0.33, $0.34
Support levels: $0.25, $0.24, $0.23

Ripple’s XRP broke free from the recent range, the price absorbed stops located below $0.290 and slipped to $0.276 in a matter of minutes. While the price has partially recovered the losses to trade at $0.276, it is still more than 3% lower from the beginning of the day. Meanwhile, XRP/USD needs to regain ground above $0.29 to mitigate the bearish pressure.
Moreover, looking technically, a sustainable move below $0.290 can be interpreted as a strong bearish signal. This barrier limited the price decline right from the end of October; however, now that it is out of the way, the sell-off may continue with the first aim at $0.270 trading below the 9-day and 21-day moving averages. This level will serve as a buffer that separates XRP from an extended decline towards the support levels of $0.25, $0.24 and $0.23.
In other words, for the upside, the buyers will need to make a sustainable move above $0.290 as soon as possible to negate an immediate bearish scenario and improve the technical picture. Nevertheless, for the upside to gain traction, the coin needs to regain ground above $0.295, while $0.32, $0.33 and $0.34 resistance levels are the ultimate aims for the bulls. More so, the technical indicator RSI (14) suggests that the selling pressure may keep dominating the market for now.
When compared with Bitcoin, the situation is becoming bleak. The market was previously trading in a symmetrical triangle which was invalidated when resistance was met at 3319 SAT. XRP was unable to break above this resistance, causing a drop down to 3126 SAT. From upside, the nearest level of resistance lies at 3320 SAT.
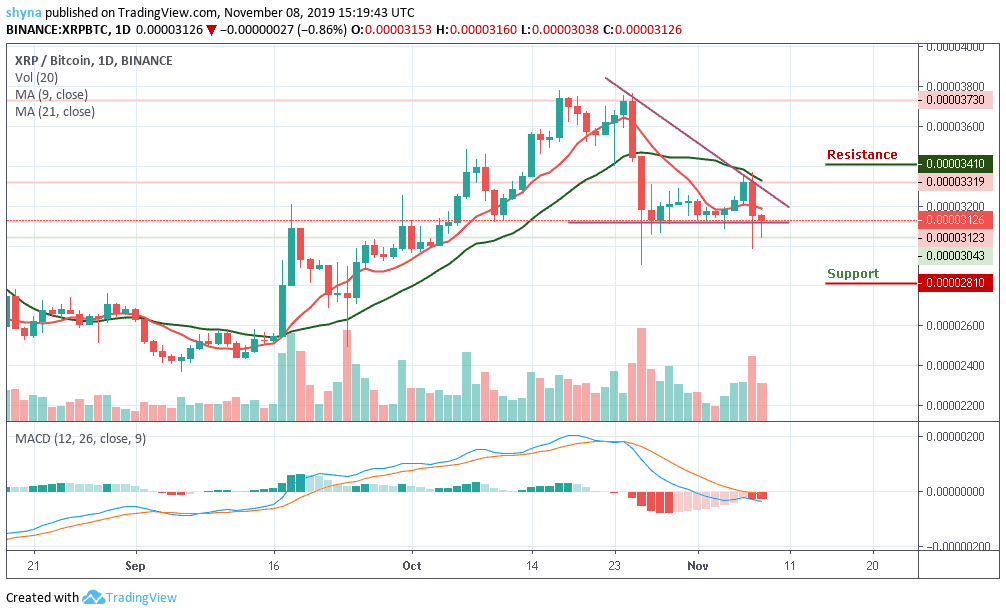
Moreover, if the bulls can break above 3200 SAT, further resistance is found at 3410 SAT and above but should in case the sellers push the price beneath the current price of 3126 SAT, the next level of support is located at 3000 SAT and more support is found at 2810 SAT and below. Therefore, the MACD signal lines are about crossing to the negative side, which is an indication of a bearish movement in the market.
Please note: Insidebitcoins.com is not a financial advisor. Do your research before investing your funds in any financial asset or presented product or event. We are not responsible for your investing results.
Join Our Telegram channel to stay up to date on breaking news coverage