Join Our Telegram channel to stay up to date on breaking news coverage
Ripple Price Prediction – May 12
The Ripple price is down by 7.54% in the last 24 hours as the value has gone below $1.55.
XRP/USD Market
Key Levels:
Resistance levels: $2.0, $2.2, $2.4
Support levels: $1.0, $0.8, $0.6
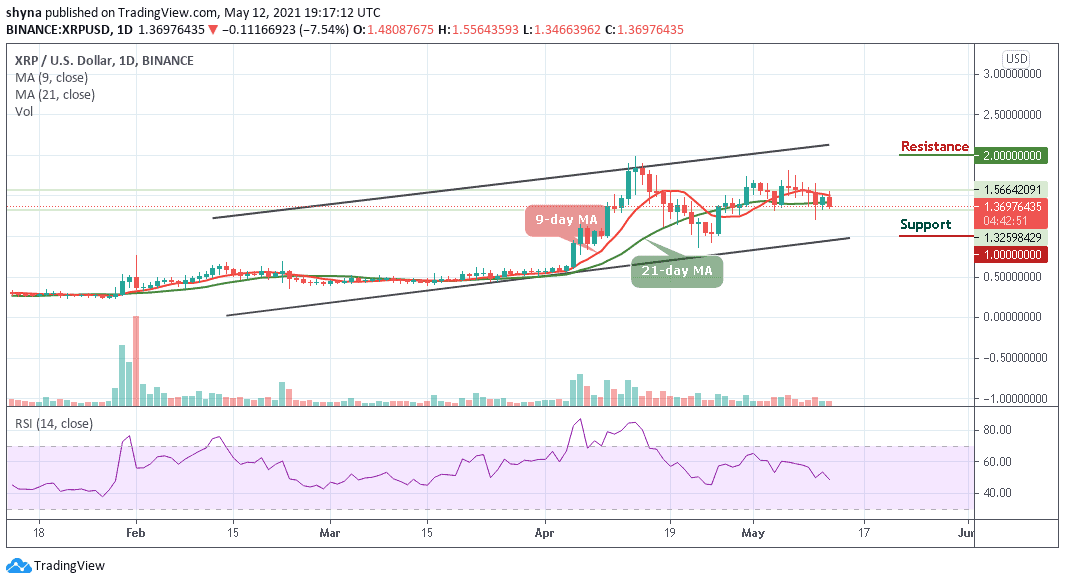
During the European session today, XRP/USD has gone up from $1.48 to $1.55 before giving a bearish signal and drops the price down below the $1.35, the Ripple price is also floating within the 9-day and 21-day moving averages as the technical indicator RSI (14) moves below 50-level. Meanwhile, a break below the 9-day and 21-day moving averages could allow the market to dig dip, but moving back above the 9-day MA might lead the market to a bullish scenario.
Ripple Price Prediction: Where is Ripple Price Going Next?
At the moment, the Ripple price has continued to demonstrate a sign of weakness across its markets. According to the daily chart, XRP/USD is currently reflecting a price drop in the market and the fall might become heavy if the bearish action continues.
Therefore, since XRP/USD is moving sideways on the short-term outlook, traders can expect the trend to keep advancing higher if the price actions still remain inside the channel. A break above the 9-day and 21-day moving averages could strengthen bulls and push the price to the resistance levels of $2.0, $2.2, and $2.4, or a channel breakdown might lead the market in a bearish scenario if the price continues to fades and the closest supports to keep eye on are $1.0, $0.8, and critically $0.6.
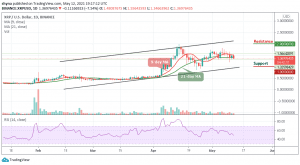
When compares with Bitcoin, XRP trades within the 9-day and 21-day moving averages, actually, the price action has remained intact within the channel. If the selling pressure continues, the Ripple price variation may create a new low. At the moment, the signal line of the Relative Strength Index (14) is moving below 55-level; the market may experience an additional negative move if the RSI (14) slides below 50-level.

Furthermore, XRP/BTC hovers at 2564 SAT which is around the 21-day MA. Any further drop below this barrier may hit the close support at 2300 SAT before breaking to 2100 SAT and below. Meanwhile, should in case a bullish movement occurs and validates a break above the 9-day MA; traders can confirm a bull-run for the market, and the nearest resistance levels are located at 3200 SAT and above.
Looking to buy or trade Ripple (XRP) now? Invest at eToro!
75% of retail investor accounts lose money when trading CFDs with this provider
Join Our Telegram channel to stay up to date on breaking news coverage